
DOI:https://doi.org/10.34069/AI/2022.51.03.30
Digitalization of economies of low and middle income countries in the context of digital transformation
Digitalización de las economías de los países de renta baja y media en el contexto de la transformación digital
Abstract
The article aims to quantify the relationship of the introduction of digital technologies on innovation, structural transformation of low- and middle-income economies through the correlation analysis of indicators of technological development (productivity of sectors) and structural transformation of Uzbekistan and Ukraine (share of value-added and employment of sectors of the economy) for 1991-2019 to assess the relationship between technology and structural shifts through the channels of value-added and employment. It is revealed that Ukraine and Uzbekistan have undergone structural transformations of the economy in favor of the service sector, while the agricultural and industrial sectors produce less and less. If Uzbekistan remains the industrial-agrarian country with an aggregate share of the added value of these sectors 59% in 2019, Ukraine transits to the post-industrial type of economy where the added value of the service sector in GDP grows (55% compared to agrarian and industrial sectors at 42%).
Keywords: digital technologies, digitalization of the economy, innovative transformations, structural transformations, transformation of the economy.
Resumen
El artículo tiene como objetivo cuantificar la relación de la introducción de tecnologías digitales en la innovación, la transformación estructural de las economías de bajos y medianos ingresos a través del análisis de correlación de indicadores de desarrollo tecnológico (productividad de los sectores) y la transformación estructural de Uzbekistán y Ucrania (participación de valor agregado y empleo de sectores de la economía) para 1991-2019 para evaluar la relación entre tecnología y cambios estructurales a través de los canales de valor agregado y empleo. Se revela que Ucrania y Uzbekistán han experimentado transformaciones estructurales de la economía a favor del sector de servicios, mientras que los sectores agrícola e industrial producen cada vez menos. Si Uzbekistán sigue siendo el país industrial-agrario con una participación agregada del valor agregado de estos sectores del 59% en 2019, Ucrania transita al tipo de economía posindustrial donde crece el valor agregado del sector servicios en el PIB (55% en comparación con sectores agrario e industrial en 42%).
Palabras clave: tecnologías digitales, digitalización de la economía, transformaciones innovadoras, transformaciones estructurales, transformación de la economía.
Introduction
The emergence of new and powerful digital technologies, digital platforms, digital infrastructure and the development of the ICT sphere have significantly changed innovation and contributed to the structural transformation of economies in different countries. The technology not only opens up new opportunities for economic activity based on innovation. It also has a significant impact on value creation and employment, causing the development of the service sector, which ensures the technologization of the economy and structural shifts. Technology has driven the digital transformation of the economy and social relations (Nambisan, Wright & Feldman, 2019). However, while in high-income countries, digital development began in the 1970s (e.g., Germany's share of communications, computer, information, and other services exports was 63% in 1975, 48% in 2008, 58% in 2017; the United States 49%, 47%, and 46% respectively; Britain 39%, 39%, and 46% respectively) (World Bank, 2021a), in low and middle-income countries the 1990s and even after 2005 through the political regime, has held back economic development and innovation. There are discussions in the scientific literature about the channels of influence of digital technology on the innovative, structural transformation of the economies of different countries. At the same time, there are no studies of the relationship between technological development and structural changes due to innovation in low- and middle-income countries.
This article aims to quantify the relationship of the introduction of digital technology on innovation, structural transformation of the economies of low- and middle-income countries.
Literature review
The workforce composition has changed substantially in recent decades (mostly since the early 200s), in part due to technological change, but the impact of digital technology on jobs, employment, and value-added in various sectors of the economy is far from certain (Bogoviz, 2020). On the one hand, the accumulated evidence of digital adoption indicates that it is moving beyond the usual scope of automation, conditioning the economic effects of technological change: recent estimates suggest that 47% of U.S. jobs will be automated over the next few decades. On the other hand, the data point to a lack of large-scale changes in employment and jobs due to technology and digitalization. For example, only 0.5% of the U.S. workforce is employed in digital industries since the early 2000s (Mysachenko, Komarov & Reshetov, 2020). It shows that there is a lack of research that proves the overall demand for jobs has declined through the computer revolution, as technologically stagnant industries (including health care, government services, and personal services) continue to create high employment opportunities (Schwertner, 2017). However, as the potential for automation expands, many sectors that were technologically stagnant in the past are becoming more technologically progressive (Berger & Frey, 2016; Hoberg, Krcmar & Welz, 2017).
Recent innovation research has tried to unpack these implications in more specific or concrete terms. For example, studies have shown how digital technologies fuel new forms of innovation initiatives that cross traditional industry/sectoral boundaries, embrace networks, ecosystems, and communities, integrate digital and non-digital assets, and accelerate the inception, scaling, and evolution of new ventures (Huang et al., 2017; Lyytinen et al., 2016; Rayna et al., 2015; von Briel et al., 2018; Younkin and Kashkooli, 2016).
Similarly, studies have also documented the ways by which established large companies (such as GE, Volvo, Johnson Controls, Caterpillar, and Boeing) have tried to redefine themselves and radically restructure their innovation strategies and practices to respond to digitization (e.g., Fitzgerald & Battilana, 2014; Svahn et al., 2017). More broadly, studies (Nambisan, 2017; Nambisan et al., 2017) have noted that the infusion of new digital technologies transforms the nature of uncertainty inherent in innovation (in terms of processes and outcomes) thereby, encouraging a radical rethink of how individuals, organizations, and collectives may pursue creative endeavors. Importantly, digitization of innovation also holds implications at a broader regional/national and societal levels with the potential to inform policy-making entities and other stakeholders. For example, studies have indicated how digitization can translate into innovation productivity gains, increased regional entrepreneurial activity, and broader economic and social benefits (Burtch et al., 2018; Kenney and Zysman, 2016). Similarly, digital infrastructures and platforms have allowed for the emergence of new work structures that redefine industry/sectoral boundaries and shape local and regional economic health (Malone, 2018;). Digitization has also compelled government agencies and other public institutions to rethink the laws, regulations, and policies related to a wide range of issues, including intellectual property rights, data privacy and security, consumer rights, worker skills and training, entrepreneurial financing and securities, incubator/accelerator programs, and regional/local economic development (Martin, 2018; Sorenson et al., 2016; Zysman and Kenney, 2018).
Digital technology, technological change, and innovation provide economic diversification and influence the structural transformation of a country. The literature uses indicators of economic sophistication to assess the level of technological development and the state and evolution of a country's technological development (Freire, 2021). Freire (2021) proposes the following system of indicators of technological development of the country's economy:
- Output per worker (in PPP US$ 2011).
- Share in global merchandise exports (%).
- High-technology manufactures exports (% of total merchandise trade).
- Digitally deliverable services exports (% of total service trade).
- ICT Service Exports (% of service exports, BoP).
- Researchers in R&D (per million people) (2018).
- Internet users (% of the population) (2017).
However, a major limitation to assessing these indicators is the lack of data, especially for low-income countries, where the adoption of digital technologies in various sectors of the economy is taking place with a significant lag compared to developed, high- and middle-income countries.
Methodology
This article uses the correlation analysis of indicators of technological development (productivity of sectors) and structural transformation of Uzbekistan and Ukraine (share of value-added and employment of sectors of the economy) for 1991-2019 to assess the relationship between technology and structural shifts through the channels of value-added and employment. Formed a system of indicators of technological and innovative development of Uzbekistan and Ukraine for 1991-2019, indicators of structural transformation of the economies of the countries.
Results
Uzbekistan is in a state of transition to a market economy, while Ukraine is actively joining the EU, fulfilling the conditions of the European integration agreement (market liberalization, development of competition, decentralization, development of e-democracy, etc.). The dynamics of adjusted net income per capita in the countries depend on the global market conditions. In Ukraine, there is a correlation between the economic recession and the decrease in income (Figure 1) in 2009 (for $1,240), In 2014-2015 (a decrease of $1,522) in Uzbekistan from 2002-2003, there is an increase in income by 2015 (an increase of $1978) and a decrease in 2017-2018 (for $1,038).
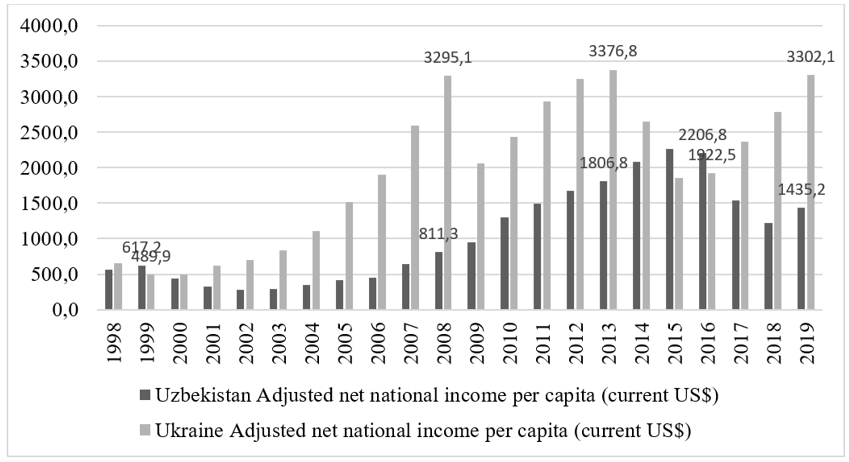
Figure 1. Uzbekistan and Ukraine adjusted net national income per capita (current US$), 1998-2019
Source: World Bank (2021a; b).
Uzbekistan's industrial-agrarian economy with an authoritarian regime As shown in Table 1, the value-added per worker in the agricultural sector of Uzbekistan was $5639,78 in 2019. In the industrial sector, it was $6723,15, and in the service sector - $4552,78. At the same time, the increase in value-added occurred in the industrial sector by $2844,88 during 2019-2010, while the service sector increased by $1788,03. The agricultural sector grew by $1475,55.
Table 1.
The dynamics of the technological and innovative development indicators of Uzbekistan, 1991-2019
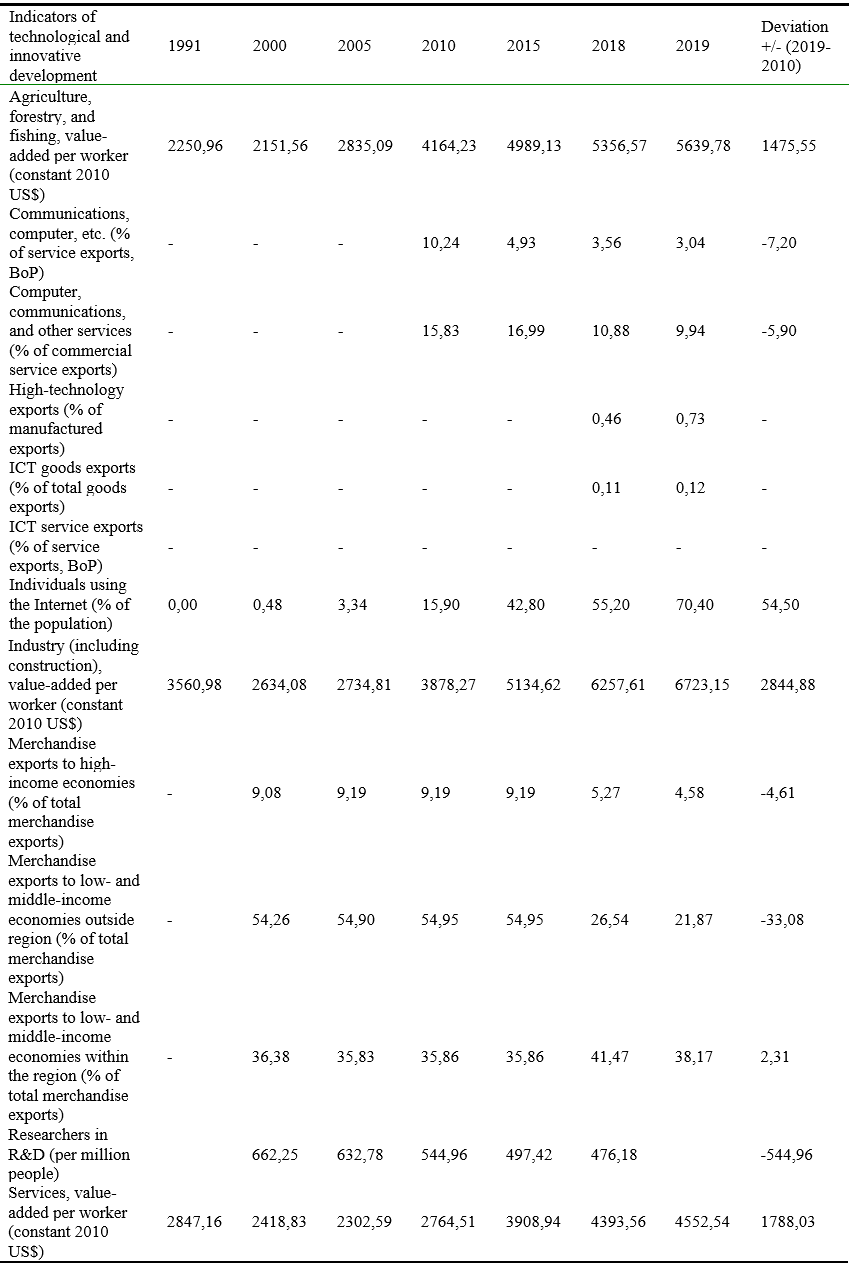
Source: calculated by the author based on World Bank (2021b).
The share of computer, ICT, and other technology exports in services exports is 10.24% in 2010, 3.04% in 2019 in Uzbekistan, decreasing by 7.2%. The share of computer, communications, and other services exports in commercial service exports also decreased by 5.9% in 2010-2019. The share of high-tech exports is only 0.73% in 2019, ICT goods exports are 0.12% in 2019, with absolutely no ICT services exports. Goods exports to high-income countries accounted for 9% of total goods exports on average from 2000-2015, falling to 4.58% in 2019. Goods exports to low- and middle-income countries outside the region accounted for 55% of total goods exports in 2000-2015, declining to 22% in 2019. Goods exports to low- and middle-income countries in the region were 36% of total goods exports in 2000-2015, declining slightly to 38% in 2019. Thus, digital technology and services are underdeveloped in Uzbekistan. The number of R&D researchers has decreased by 545 people per million population.
Compared to Uzbekistan, Ukraine has active processes of Europeanization and integration into the EU. The economy of Ukraine - raw material (the export of raw materials industries and agricultural sector in developed countries prevails) and industrial-agrarian. The value-added of the agrarian sector increased by $3,213.02 per employee in 2019-2020, while the added value of industry decreased by $915.06 per employee, which means a decrease in productivity in the industrial sector, and a gradual increase in productivity of the agrarian sector. At the same time, the service sector is growing moderately: the value-added increased by $233,18/per worker and is significantly higher than the agricultural and industrial sectors.
Compared to Uzbekistan, Ukraine has a more developed ICT sector: the share of ICT and equipment exports in total exports was 14.23% in 2019, which has decreased significantly in 2018-2019 (by 18.73%).
Table 2.
The dynamics of technological and innovative development indicators of Ukraine, 1991-2019
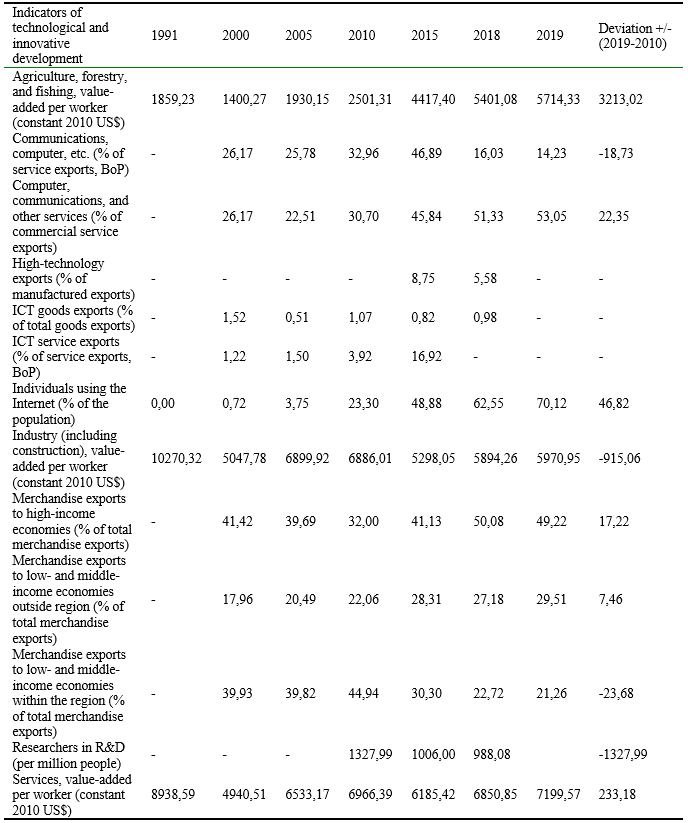
Source: calculated by the author based on World Bank (2021c).
Meanwhile, the share of computer, communications, and other services in commercial service exports increased by 22.35% over 2019-2010 to 53.05%. The share of high-tech exports is 5.58% in 2018. Despite differences in technological development, countries have the same level of Internet use by the population - 70% in 2019. The share of ICT sector exports was 1-1.5% in 2000-2018 of total merchandise exports. The share of exports of ICT sector services increased significantly in 2015 to 17% from 4% in 2010 due to the active development of the IT industry in Ukraine.
Exports of goods to high-income countries accounted for 38.66% of total goods exports on average in 2000-2015, rising to 49.22% in 2019. Goods exports to low- and middle-income countries outside the region accounted for 22.2% of total goods exports in 2000-2015, rising to 29.51% in 2019. Exports of goods to low- and middle-income countries in the region accounted for 38.75% of total goods exports in 2000-2015, with a significant decline to 21.26% in 2019.
Thus, Uzbekistan is gradually undergoing an innovative and structural transformation of the economy: the country is increasing the productivity of the agricultural, industrial, and service sectors, but the ICT sector is virtually undeveloped. In comparison, in Ukraine, there are no significant structural transformations due to a significant drop in productivity of the industrial sector, with stable growth in productivity of the agricultural sector due to technology and a slight increase in productivity of the service sector. At the same time, Ukraine saw an increase in exports of ICT services in the country's commercial exports, and there is a significant excess of the added value of the services sector over the added value of the industry.
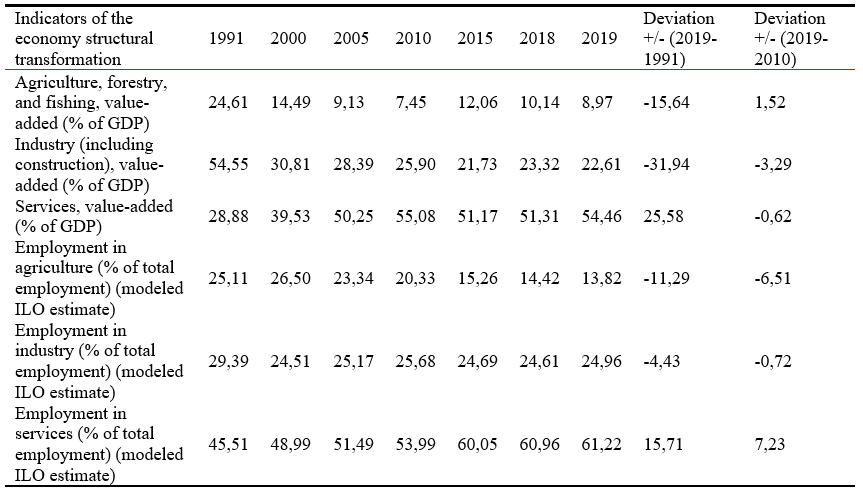
Table 3 shows the indicators of structural transformation of the economy of Uzbekistan. Despite the growth of productivity in the agricultural sector and industry, the share of the added value of agriculture in the country's GDP decreased by 11.55%, industry by 4%, while the share of the service sector increased by 6.37%. Accordingly, employment in the agricultural and industrial sectors decreased (by 15% and 3%, respectively), employment in services increased by 17.7% through 1991-2019. It means a gradual structural and innovative transformation of the economy at the expense of technology in Uzbekistan.
Table 3.
The dynamics of indicators of the economy structural transformation of Uzbekistan, 1991-2019

Source: calculated by the author based on World Bank (2021b).
The share of the value-added of the agrarian sector in Ukraine is half as much as in Uzbekistan (9% and 25% respectively), which also decreased by 16% from 1991 to 2019. The share of the value-added industry in GDP has also significantly decreased - by 32% for 1991-2019, but the indicator is significantly lower compared to Uzbekistan (22.6% and 32.6% respectively). The share of the added value of the service sector in Ukraine's GDP increased by 25.5% over 1991-2019, significantly higher than that of Uzbekistan: 55% in 2019 compared to 33% of Uzbekistan.
Table 4.
The dynamics of structural transformation indicators of Ukrainian economy, 1991-2019
Source: calculated by the author based on World Bank (2021c).
Thus, Ukraine and Uzbekistan have undergone structural transformations of the economy in favor of the service sector, while the agricultural and industrial sectors produce less and less. If Uzbekistan remains an industrial-agrarian country with an aggregate share of value-added of these sectors at 59% in 2019, Ukraine is transitioning to a post-industrial type of economy in which the value-added of services in GDP is growing (55% compared to the agrarian and industrial sectors at 42%).
Correlation analysis of indicators of technological development (productivity of sectors) and structural transformations of Uzbekistan (share of added value and employment of sectors of the economy) indicate a strong direct connection between productivity in the agrarian and industrial sector of the country and productivity of service sector (correlation coefficients 0,9017 and 0,9858 respectively). In addition, a strong inverse relationship is found between the productivity of the three sectors and the level of employment in the agricultural sector. The reduction in employment in agriculture leads to an increase in the productivity of all sectors of the economy at the expense of technological development. At the same time, a strong direct relationship is found between productivity in all sectors and employment in the service sector. This means that structural changes in employment have a positive effect on labor productivity, which characterizes the innovativeness of the economy. It can also mean that the growth of productivity of the sectors of the economy of Uzbekistan, which characterizes innovativeness, contributes to the structural transformation of employment in the country.
Table 5.
The correlation analysis of technological development and structural transformation of indicators in Uzbekistan

Source: calculated by the author
* significant at 5%
The correlation analysis of the technological development and structural transformations indicators (productivity of sectors) of Ukraine (the share of value-added and employment of economic sectors) indicate an average inverse relationship between the productivity of the agricultural, industrial sectors and the productivity of services (-0.723 and -0.529, respectively).
Table 6.
The correlation analysis of technological development and structural transformations indicators in Ukraine
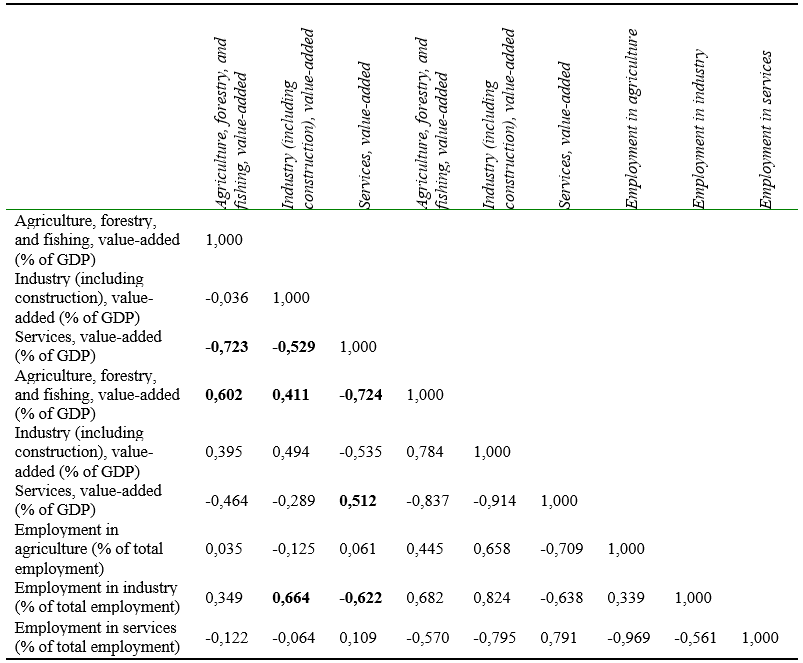
Source: calculated by the author based on World Bank (2021c).
The highlighted correlation coefficients are significant at 5%
The estimated correlation coefficients indicate an average direct relationship between the productivity of the agricultural and industrial sectors and the share of value-added of the agricultural sector (0.602 and 0.411, respectively). At the same time, there is a strong inverse relationship (-0.724) between the productivity of the service sector and the share of agricultural value-added in GDP. The productivity of the service sector contributes to its share of GDP value-added (0.512). The productivity of the industrial sector has a direct positive effect on employment in that sector (0.664). However, service sector productivity harms industrial employment (-0.622).
Discussion
In Uzbekistan, the development of the digital economy and society at the national level began only in 2018 with the adoption of the Decree of the President of the Republic of Uzbekistan "On Additional Measures for the Implementation of the Digital Economy, Electronic Government and Information Systems in Public Administration of the Republic of Uzbekistan" on December 13, 2018. The decree should help create conditions for the rapid development of the digital economy, further improvement of the public administration system, development of digital infrastructure, attraction and consolidation of investor funds for projects related to the development of the digital economy, promotion of privatization enterprises, and competition, introduction of innovative management with the involvement of qualified specialists, modernization and technological re-equipment of telecommunications equipment and the like. Digitalization of the country provides for step-by-step ensuring full coverage of the territory of the Republic of Uzbekistan with access to the global Internet at the level of developed countries and ensuring the transfer of all government services to data centers (Shadibekova, 2019).
In Ukraine, as well, the intensification of the implementation of digital technologies to ensure innovative changes began in 2018 with the adoption by the Cabinet of Ministers of Ukraine of the Concept of development of the digital economy and society of Ukraine for 2018-2020 and the approval of the action plan for its implementation. Similar to Uzbekistan, in Ukraine users and the private sector are significantly ahead of the state (government) and industry, the agricultural sector in the digital development (the same level of use of the Internet by citizens). State technological changes are not enough for the innovative and structural shift in the economy. The main barriers to the introduction of digital technology in the economy of Ukraine are an institutional, infrastructural, ecosystem, public administration, and the development of e-government and democracy. In particular, the main institutional barriers are the low level of involvement of state institutions in the implementation of the Concept of Digital Economy and Society Development (Digital Agenda of Ukraine), the mismatch between the global digital challenges and the capabilities of the relevant legislation (lack of legality of progressively developed bills), the mismatch between national, regional, industry strategies and development programs to digital opportunities. In the field of digital infrastructure development, the following main problems are worth highlighting:
- the low level of coverage of the territory with digital infrastructure (about 60% in Ukraine);
- the lack of certain types of digital infrastructure (in particular, the Internet of Things infrastructure, electronic identification, etc.);
- unequal access of citizens to digital technologies, and new opportunities (digital gaps).
The main ecosystem barriers are weak state policy of stimulating and encouraging the development of innovative economy, immature market of investment capital, outdated education system, teaching methods, especially in IT specialties, lack of priorities in STEM education, supporting soft skills rather than entrepreneurial skills, imperfect models of technology transfer and consolidation of knowledge and skills; lack of highly qualified personnel who could provide the full development of digital economy and digitalization In the field of e-government and governance ("state in a smartphone") there is a low level of digitalization of public services through the weak motivation of government institutions (there is no full understanding of the potential benefits of full digitalization).
Conclusion
Uzbekistan's industrial-agrarian economy with an authoritarian regime is in a state of transition to a market economy, while Ukraine is actively joining the EU, fulfilling the conditions of the European integration agreement (market liberalization, development of competition, decentralization, development of e-democracy, etc.). Digital technologies and services are poorly developed in Uzbekistan. The number of R&D researchers has decreased by 545 people per one million population. Compared to Uzbekistan, Ukraine has active processes of Europeanization and integration into the EU. The economy of Ukraine - raw material (the export of raw materials industries and the agrarian sector in developed countries prevails) and industrial-agrarian. Compared to Uzbekistan, Ukraine has a more developed ICT sector: the share of ICT and equipment exports in total exports was 14.23% in 2019, declining significantly in 2018-2019 (by 18.73%). Uzbekistan is gradually undergoing an innovative and structural transformation of its economy: the country's agricultural, industrial, and service sectors are growing in productivity, but the ICT sector is virtually undeveloped. In comparison, in Ukraine, there are no significant structural transformations due to a significant drop in productivity of the industrial sector, with stable growth of productivity of the agricultural sector due to technology and a slight increase in productivity of the service sector. At the same time, Ukraine saw an increase in exports of ICT services in the country's commercial exports, and there is a significant excess of value-added of the services sector over the value-added of industry. Ukraine and Uzbekistan have seen a structural transformation of their economies in favor of the service sector, while the agricultural and industrial sectors are producing less and less. While Uzbekistan remains an industrial-agrarian country with a combined value-added share of these sectors at 59% in 2019, Ukraine is transitioning to a post-industrial type of economy with a growing value-added of services in GDP (55% compared to the agrarian and industrial sectors at 42%).