DOI:https://doi.org/10.34069/AI/2022.51.03.27
Visualization as a Means of Influence (on the Example of Student Periodicals)
ВІЗУАЛІЗАЦІЯ ЯК ЗАСІБ ВПЛИВУ (НА ПРИКЛАДІ СТУДЕНТСЬКОЇ ПЕРІОДИКИ)
Abstract
Visualization is a modern tool of communication with media perceptive readers. Visual means allow to influence the emotional sphere of the reader, replace certain information and the number of characters, diversify the compositional design of publications and create their aesthetics, which affects the image and reputation of periodicals. Visualization is a tool that is actively used in student periodicals, the target audience of which is modern youth with clip thinking. In order to attract the attention of such readers, to intensify their attention, the editors of student publications diversify the content with the help of a set of visual aids. In particular, typical forms of visualization in publications are photographs, drawings, pictures, symbols, comics, puzzles, tables, graphics, variation of page space with fonts, colors, decorative lines. The article analyzes the content of student magazines in Ukraine and Poland on the means of visualization and states the effectiveness of visual communication for these publications. As a result of research it is established that visualization has specificity of the influence (complexity and systematics). Determining criteria for the effectiveness of visual communication of student periodicals are visual activity, the degree of cognitive perception, compositional organization, supragraphemics, topographemics, non-pictographic elements, text positioning.
Keywords: visualization, student periodicals, media perceptive readers, tool of communication, the effectiveness of visual communication.
Анотація
Візуалізація – сучасний інструмент комунікації з медіаперцептивними читачами. Візуальні засоби дозволяють впливати на емоційну сферу читача, замінюють певну інформацію та кількість знаків, урізноманітнюють композиційне оформлення видань та створюють їхню естетику, що впливає на побудову іміджу й репутації періодичного видання. Візуалізація – засіб, який активно застосовано в студентській періодиці, цільова аудиторія якої – сучасна молодь із кліповим мисленням. З метою привернення уваги таких читачів, активізації їхньої уваги редакції студентських видань урізноманітнюють контент за допомогою комплексу візуальних засобів. Зокрема, типовими формами візуалізації в цих виданнях є фотографії, малюнки, рисунки, символи, комікси, ребуси, таблиці, графіки, варіювання простору сторінок за допомогою шрифтів, кольору, декоративних лінійок. У статті здійснено контент-аналіз студентських журналів України та Польщі на предмет засобів впливу візуалізації та встановлено ефективність візуальної комунікації для цих видань. У результаті дослідження встановлено, що візуалізація має специфіку свого впливу. Зокрема, це комплексність (наявність груп засобів, інструментів візуалізації) та системність (безперервність впливу візуалізації на когнітивному, афективному, конативному, сугестивному рівнях; візуальна активність, наявність засобів візуалізації в кожному номері видань, різноманітність представлених засобів візуалізації). Визначальними критеріями ефективності візуальної комунікації студентської періодики є візуальна активність, ступінь когнітивного сприйняття, композиційна організованість, супраграфеміка, топографеміка, непіктографічні елементи, позиціювання тексту.
Ключові слова: візуальна комунікація, студентська періодика, медіаперцептивні читачі, засіб комунікації, ефективність візуальної комунікації.
Introduction
Modern communicative space operates in the conditions of accelerated information exchange, increasing amount of information and reducing the time for its assimilation, changing the habits of readers. Editors of any type of publication communicate with media perceptive readers, who are characterized by clip thinking. Such readers do not perceive information as a whole, but as a series of unrelated facts, parts, and events. M. Vikulova & Yu. Rizen (2018) notes that with such thinking, any image does not linger in the mind, but remains new. The scheme by which the modern reader views the material corresponds to the following sequence: image – title – text. The researcher V. Shevchenko (2013) calls such a scheme in accordance with the principles of clip thinking and recognizes it as one that helps to present content in the form as close as possible to the needs of the reader, making certain visual accents. In order a modern reader reads a media message, it must meet the criteria of «intelligibility», «readability», «visual convenience» and appeal to modern trends in information consumption. One such trends is the visualization or translation of data, information into graphic images; systematic and purposeful display of information in the form of tables, charts, graphs, etc. (Chemerys, 2018).
The purpose of the paper is to establish the specifics of the impact of visualization in student periodicals.
The task of the paper is to establish typical forms of visualization in student publications and their functional purpose; evaluate the effectiveness of visual communication of student periodicals.
The object of the paper is the student journals «MAGMA» (Zaporizhzhya National University, Ukraine) and «Suplement» (Magazyn Studentów Uniwersytetu Śląskiego w Katowicach, Katowice, Poland).
Literature Review
The researcher M. Yatsimirska (2015) considers visualization to be an objective response to modern challenges in the information space. T. Troyan (2018) points to a change in the paradigm of information perception, the search for new visual forms of communication that would meet the demands of modern society and synthesize visual and verbal components. The researcher considers visualization to be such a new form of communication, which she defines as consistent art. O. Gladun (2012) notes that the arrival of a new visual paradigm is due to oversaturation of the information field, and the fact that not all information can be conveyed in the classical sign way, and the need for comfortable translation of the most dense information flow, and the need to eliminate information noise (unnecessary, inaccurate information, which interferes with clear perception). Therefore, the task of periodicals is to create a successful composition, compose images and text, ensuring the optimal amount of material and attracting all channels of influence on the reader. That is, to create polycode materials which would contain the unity of verbal and visual elements. According to T. Yezhyzhanska (2012), visual elements are combined in the design of the page and the publication in general in order to increase the speed of understanding the message, avoid information overload, facilitate data retrieval.
The popularization of the culture of perception in the media, the appeal to the visual analyzer of readers due to the iconic turn – the transition from a culture of logocentrism to the visual due to the dominance of technologies based on visual perception and diversity of artistic and non-artistic visual forms. The reasons for the use of semiotic resources by periodicals are intensive development of technology, the digital age, improving the forms and methods of oral and written interaction (Makaruk, 2012). However, perhaps the main reason for the popularity of visualization is that it provides and creates the illusion of independent understanding of information. This opinion is expressed by L. Massimova (2013), noting that the visual media text or creolized text, formed from different semiotic systems, is the most interesting for the consumer. The elements of visuals allow to create deeper connections with the readers (Kujur & Singh, 2020).
Visualization, according to V. Shevchenko (2013), is the process of visualizing content or message. This is the integration of words, images, forms into a single communicative series. According to N. Manko (2009), visualization is a semantic compression of the text. Visualization is a tool that helps editorial staff to communicate with media perceptive readers. Visualization is the communication through visual mediation, the mediation of visual elements that create their own visual identity. Visualization becomes another conditional model of impact on the reader, such as AIDA (attention, intertst, desire, action). This model is called 5 As. According to this model, the visual elements play a role in all 5 stages – the perception of information; influence, impression; question; action; propaganda, repetition of action (aware, appeal, ask, act, advocate). It must be admitted that image itself or the placement of images is not a visualization and does not mean the presence of visual communication. Researcher Yatsimirska (2015) notes that the image functions as an independent text until the reader translates visual images into verbal ones and perceives the text as a whole. In order for visual communication to take place, there must be, firstly, the unity of verbal and visual elements, secondly, composing or placement, combining these images, thirdly, the reader was able to decode these images and understand their message, meaning, functional appointment. D. Roam (2013) points to the need for several actions, processes on the part of the reader to participate in visual communication – to see, imagine, show. The reader must not only notice the fact of the illustration, but also understand its relevance, abstractly process the information, form the meaning of what is seen and, ideally – also spread this image and its meaning to the mass audience. In addition, the condition of visual communication is the presence of a visual environment in which the sender and the addressee speak one symbolic language on common themes (Shevchenko, 2013).
Visual communication is the transmission of information through visual language (images, signs, infographics) and visual perception. Researcher V. Shevchenko (2013) notes that this is a way of communication, interaction, carried out with the help of visually perceived images. O. Kolisnyk, V. Volkova & K. Lukyanenko (2020) divides such communication into several types – visual-subject (using elements of sculpture, design, architecture), visual-graphic (using graphics, painting, photography), visual-dynamic (using the principles of mechanics, optics, electronics).
Student periodicals are printed, derived from printed and purely network, diverse in terms of territorial distribution (or distribution) and funding of newspapers and student magazines, the target audience of which are students. These are publications that publish relevant and interesting information for students which are created by students or with their active participation.
The editors and readers of such publications, as a rule, are in the same category by generation, and therefore have a good understanding of current trends, use the same habits of clip thinking. This generation used to receive information by impulses and focus not on ideas, but on individual «flashes» and images. Therefore, the main form of presentation for this category of recipients was the clip, a sequence of snapshots that does not oblige (Cheremsky, Bokareva & Deineko, 2016). So visualization is exactly the tool used by student periodicals to influence the readership.
Methodology
The essence of the concept of visualization is determined by the method of analysis and synthesis. Methods of monitoring, content analysis and comparative analysis were applied to determine typical forms of visualization in student periodicals of Ukraine and Poland on the example of «MAGMA» and «Suplement» magazines and to highlight the functional purpose of different types of pictorial content in these publications. The method of semantic differential is used to evaluate the effectiveness of visual communication in student periodicals.
Results and Discussion
Magma Magazine is published by students of Zaporizhzhya National University (ZNU). The thematic range covers everything that worries ZNU, what its students and other residents breathe. The total volume is 20 pages, the frequency of publication is once a month. To establish the quantitative and qualitative ratio of visualization tools, the archive of the publication from the last 16 issues was monitored and content-analyzed. As a result, it was found out that the pictorial content of the student magazine «MAGMA» by the degree of abstraction is represented by such forms as real-subject (photographs, pictures), conditional-subject (symbols, logo, word cloud, caricature, demotivators), abstract forms of visualization (diagrams, infographics). The quantitative ratio of the most frequent using image content is presented in Figure 1.
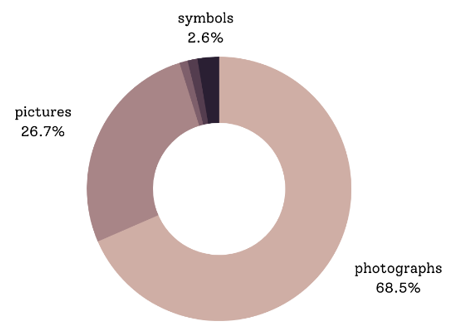
Fig. 1. Most frequent using image content of the student magazine «MAGMA».
Source: Authors’ computation
The qualitative ratio of visualization tools will be presented in the Table 1 as a correlation of reference situations (topics or context of publications, their titles) and semiotic tools that represent them.
Table 1.
Correlation of reference situations and semiotic tools.
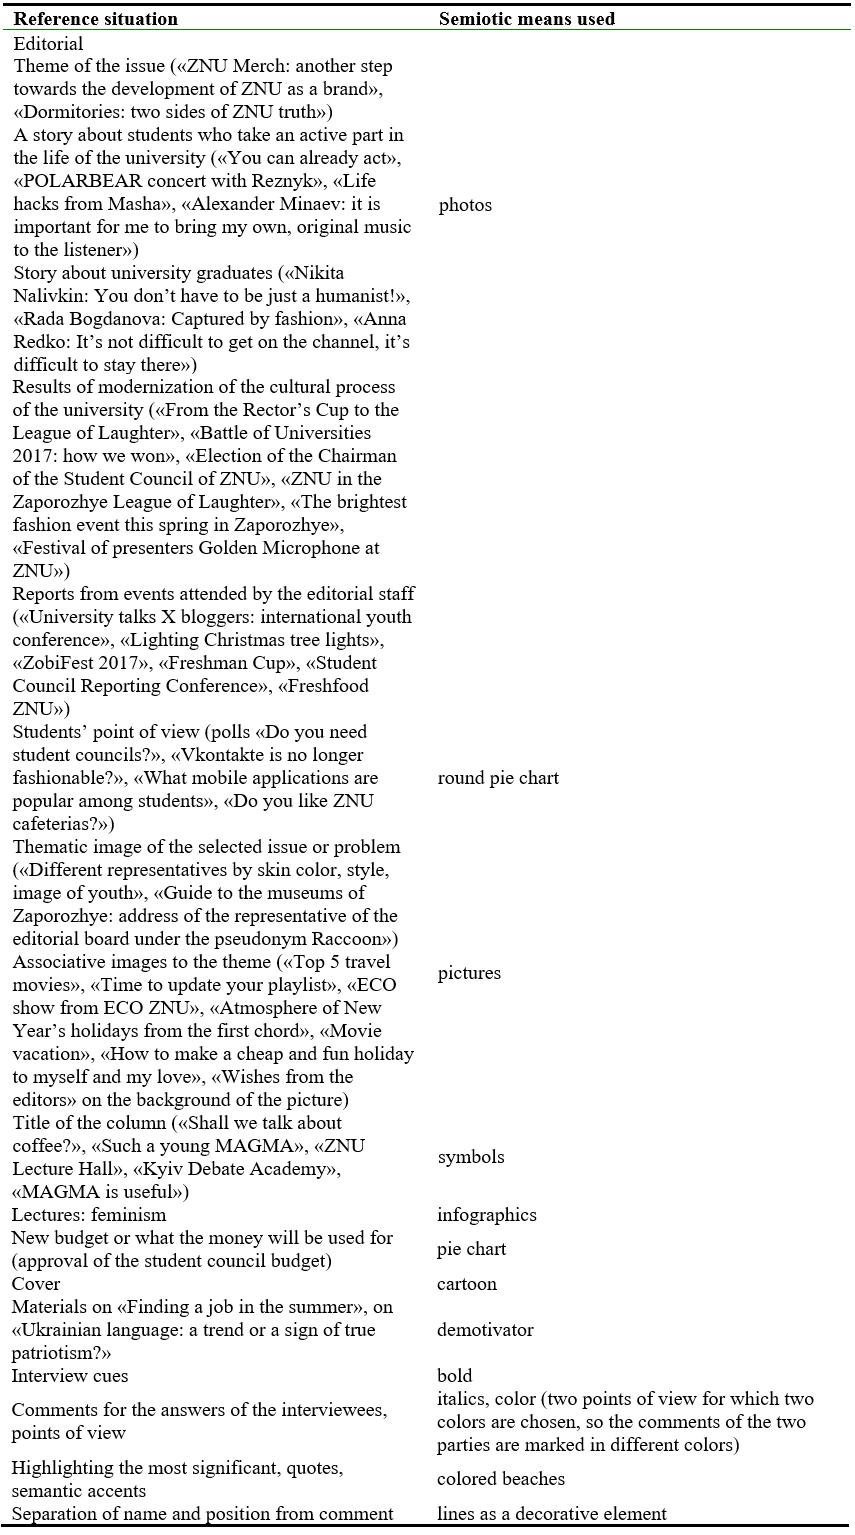
Thus, Figure 1 and Table 1 show the dominance of such a form of visualization as photography (68.5%). This dominance is due to the desire of the editors to establish contact with the readership, using real visual facts. Live photos, without artistic processing, convey a real picture of reality, thus adding credibility to the opinions of the authors in the text of publications. In addition, such photographs reproduce the reality that is familiar to all students and accordingly to the readers of the magazine. Real photos are additionally tuned to one associative and emotional wave of readers and editors. The need for real photos is due to the structural and semantic composition of the publication – articles about students, about events in this university, the topic of the issue about the most pressing issue or problem in the university, reports on events and more.
Such a form of visualization as pictures is less popular (26.7%). These are usually thematic and associative images to the topic. Such images are a background for text blocks or a stand-alone illustration to illustrate information in the text. In thematic terms, it is content about movies, music, books, posters of cultural events, information about traditions for a particular holiday. Pictures are a representation of the covers of books or music albums, movie posters or cultural events, create the atmosphere of these events or holidays.
The rating of symbols (2.6%) completes the ranking of the top 3 means of visualization. Each symbol encodes certain information, partially replaces a certain thesis in the text, supports a certain author’s position. The limited use of this form can be explained by the difficulty of finding a reader who can decode such a symbolic visual message. Therefore, the symbols used in this magazine are easy to decode – these symbols in the titles of the rubric (raccoon symbol and rubric «Let’s talk about coffee?», Cake symbol and rubric «Such a young MAGMA», light bulb symbol and rubric «ZNU Lecture Hall», academy logo and rubric «Kyiv Debate Academy», symbols in the format of program icons and the rubric «MAGMA is useful»). They add credibility, clearly demonstrate the content of publications, add to the publications and opinions of the authors such forms of visualization as charts and infographics (1.1%). These visualization tools demonstrate the ability of authors and editors to summarize trends, trace causal relationships, work with quantitative data.
A student publication presenting youth communication does not do without visual forms that appeal to clip thinking, encode a certain amount of information and additionally attract readers’ attention – it is a caricature, demotivators (1.1%) (Figure 2).
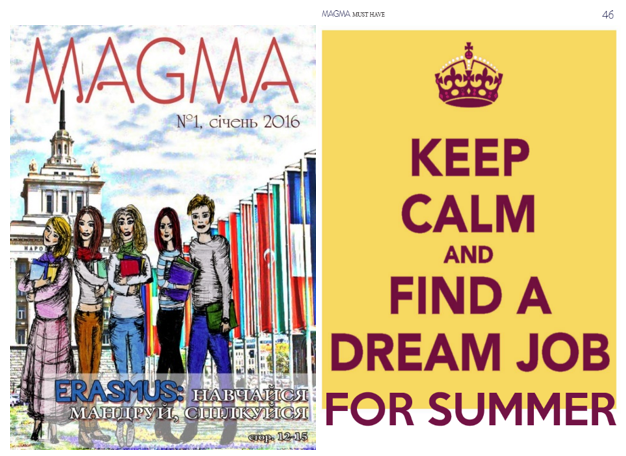
Fig.2. Caricature (left), Demotivator (right) in MAGMA magazine.
URL: https://issuu.com/magma_znu
Having established typical forms of visual communication in the magazine «MAGMA», we are able to determine their functional purpose. Since the visual communication transmits the information and ideas by using symbols and imagery, it can affect the viewers either affectively (emotionally) or cognitively (logically) or both reactions simultaneously (Fahmy, Bock & Wanta 2014).
Photographs belong to the type of visual images that generate a sense of reality (Yatsimirska, 2015). Therefore, their functional purpose is to reflect current events, provoke certain reflections on the hero of the publication or interview (portrait photos), mobilize the sensory reaction of readers, presenting photos to the topic of the issue (the most pressing issue or problem), add credibility, clearly demonstrate content publications (photos to reports), add weight to publications (Dashchenko & Stakhurska, 2019), recreating the reality or an interesting perspective of the object of photography.
Pictures as a means of visualization perform the function of meaning-making, generating the content of the message and space for the emergence of new meanings of known images and symbols. In addition, they perform a compositional function, creating a certain scheme for reading (background, thematic and associative picture).
Caricatures and demotivators are intended to reproduce the author’s position on the vision of reality, world, knowledge, experience in concrete-sensory images. Such visual forms create the effect of situational expression, an atmosphere of ease, promote interest, enrich with new meanings (Chemerys, 2018).
Functional purpose of diagrams, word clouds, infographics in student periodicals – to strengthen the main idea of the material (trends, dependencies, demonstration of positive or negative aspects), duplicate the verbal series, replace some verbal units, encourage action (after reviewing certain dependencies, trends), to reveal the author’s intentions (Makaruk, 2012), demonstrating the dependencies in time, explaining the facts in a certain order, illustrating a complex problem.
The use of symbols, graphic decorative lines, variation of page space with figured corners in frames, bold and italic selections, colored beaches are aimed at activating reader interest, creating a favorable impression of the page, ensuring continuous influence of all pages through the same style techniques (Shevchenko, 2013).
Thus, the visual communication of student periodicals on the example of the magazine «MAGMA» is based on the principle of authenticity (the predominance of this form of visual content as real photos); aims to compress characters, and therefore there are visual aids such as cartoons, symbols, charts; ancillary visualization functions, in addition to interest, visualization, it is also the composition of space through font design, text blocks.
The thematic magazine «Suplement» covers the life of the university, current events of academic life and Silesian Voivodeship, cultural and scientific activities of students, issues relevant to youth (labor market, career opportunities, seminars, internships), leisure students (exhibitions, clubs, concerts, travel, foreign educational exchanges). The total volume is 36 pages, the frequency of publication is once every two months.
As a result of monitoring and content analysis of the archive of the publication from the last 16 issues it was found that the pictorial content of the student magazine «Suplement» by the degree of abstraction is represented by such forms as real-subject (photographs, drawings, pictures), conditional-subject (symbols, puzzles, comics, posters), abstract forms of visualization (table, graph). Quantitative ratio of the most frequent using image content is presented in Figure 3.
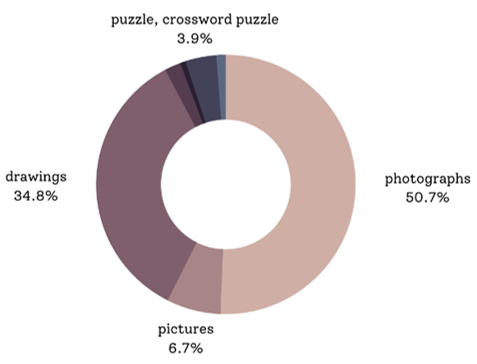
Fig. 3. The most frequent using image content of the student magazine «Suplement». Source: Authors’ computation
The qualitative ratio of visualization tools will be presented in the Table 2 as a correlation of reference situations (topics or context of publications, their titles) and semiotic tools that represent them.
Table 2.
Correlation of reference situations and semiotic tools.
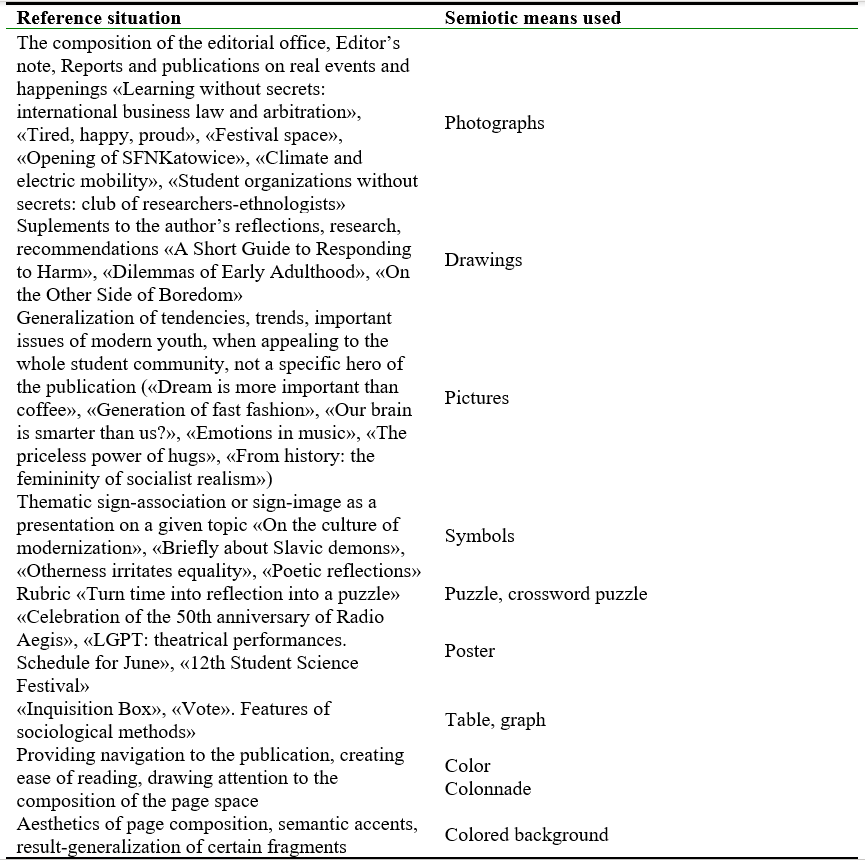
Thus, photographs as a visual form that dominates the magazine «Suplement» (50.7%), add credibility to the statements and views of the authors of publications, add credibility to the described phenomena, events, create the effect of personalized appeal to readers, because they reproduce reality, which is familiar to readers-students of this university, create the effect of presence, presenting visual content to reports. In addition, it is also an image-creating function, because high-quality photo content forms the image of the university, increases its rating of perception of readers and the public, and increases the rating of the publication that publishes high-quality, reliable and relevant photos. Also, photographs as a form of visualization allow you to present the figure – the hero of the publication or interview, replace a text fragment by encoding information with a visual, allow readers to form their position and impressions of the hero of the publication, looking at his photo. Hero, or hero in action, at work, in this case depicts not only the character, but also the situation referred to in the material (this may be, for example, an artist with his paintings or any employee at work) (Soroka, 2017).
Pictures are no less important in the visual content of this student magazine (34.8%). First, it is the creation of aesthetic realization of the plot idea for publications, because thematically selected pictures attract attention, facilitate the perception of textual characters, create an appropriate mood atmosphere from reading the text, cause certain allusions and reflections.
Drawings in quantitative terms rank third among the visualization of the magazine «Suplement» (6.7%). Author’s drawings attract the attention of readers, interest and motivate to view the publication. In addition, thematically illustrate publications, contribute to the successful composition of pages or covers, set a certain emotional vector before reading the publication. Also, the drawings, which are independently developed by the editors, implement the evaluation function, helping to understand the position of the author, his attitude to events.
Symbols (1.3%) play the role of visual accents, adding atmosphere and plot to the composition of the reversals. Symbols are thematically related to the publication, and therefore tune the reader to the topic, are a semantic landmark for him.
Comics, puzzles, crossword puzzles (3.9%) (Figure 4) – a form of visualization that performs a recreational function, because it allows readers to distract from reading publications. No less important is the cognitive function, because solving crossword puzzles often requires additional intellectual search and reflection. A separate feature is for puzzles and comics. It is a communicative function, which consists in finding a reader who is able to decode the visual message and, accordingly, solve the presented visual riddle or trace and understand the story on the example of comics. The main advantage of comics is that it offers extremely concise but emotionally rich information, in which there is nothing superfluous (Osadchy & Osadcha, 2014).
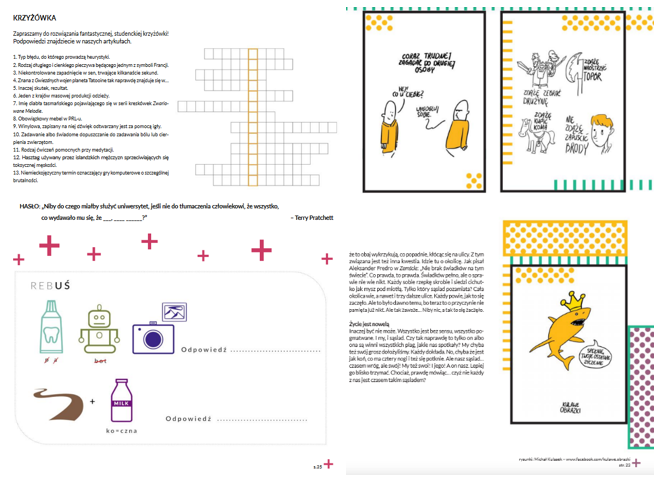
Fig.4. Puzzle, crossword puzzle (left), comics (right) in magazine «Suplement».
URL: https://issuu.com/magazynsuplement
Functional purpose of the poster (1.3%) – to further interest readers, encode text characters in a readable form, visualize certain information with symbols and variations of colors, fonts, decorative lines and more.
Tables, graphs (1.3%) (Figure 5) – visual forms that are not very used in this magazine, but show the ability of the team to work with mathematical data, to visualize complex relationships, trends, causal relationships. For readers, this is an illustration of the information provided and additional information for decoding.
, graph (right) in the magazine.png)
Fig. 5. Table (left), graph (right) in the magazine «Suplement».
URL: https://issuu.com/magazynsuplement
Varying the space of pages with the help of colored squares, colon-number design adds convenience in reading publications, promotes better navigation of publications, attracts attention with its aesthetics and plot design.
Visual communication must occur according to certain rules and criteria. In particular, the effectiveness of such communication can be assessed by such parameters as: visual activity, dynamism, structure, aesthetics, degree of cognitive perception, increasing contrast, compositional organization (Babiy & Chuchuk, 2019) or functionality, compositional and artistic formation, rationality, structure, flexibility, organicity, imagery, integrity (Shevchenko, 2013). Equally important are the components of visualization: syngraphemics (punctuation variation), supragraphemics (font variation), topographemics (spatial placement of text), non-pictographic, non-photographic elements, text positioning (selection, insertion) (Makaruk, 2012).
The effectiveness of visual communication in the student publications «MAGMA» and «Suplement» will be assessed by the categories of high, medium, low by a number of parameters listed below.
Visual activity. Criterion that means the change of visual forms within one issue and the archive of pictorial content in general, how typical (repeated) forms of visualization from issue to issue. For MAGMA and Suplement we visualize visual activity as moderate activity, because the typical forms for both magazines are repeated from issue to issue (photographs, drawings, pictures, symbols), which indicates the concept of publication and unification of its design. However, such stability is sometimes accompanied by a variety of visual forms through tables, graphs, infographics, comics, demotivators, and so on.
The visual activity parameter is also affected by the ratio of materials to which visualization is not submitted and materials with visualization tools. Due to this criterion, the editors of both student magazines actively use visualization tools, and purely textual materials are missing. Visual content is provided with each publication.
Degree of cognitive perception. A parameter that indicates the use of forms that require additional time to decode the visual, or forms that promote reflection. Cognitive visualization – comprehension of visual images on the basis of available background knowledge, communicative competence of the reader (Zhitenyova, 2019). Photographs and drawings have ease in cognitive perception, because they reproduce the immediate reality, and therefore are clear and understandable. Forms such as pictures and symbols are of medium complexity, because you need to understand the hidden meaning of these forms, their relationship to the topic or text for which they are used. And can be difficult (high complexity of cognitive perception) to decode a certain category of readers visual forms such as comics, puzzles, graphics, charts. Selected journals are characterized by ease of cognitive perception, as the use of forms that require additional decoding (puzzle, comics, infographics, graph, table) is limited. In addition, text tables or graphs, infographics have text support, which allows you to understand the essence of the publication without these visual elements. Puzzles or comics are visualization tools for secondary communication. That is, one that is of additional interest does not contain important messages that should be read by all readers. Such forms can be skipped while reading, without losing the semantic perception of the entire issue. Also, these forms perform a recreational function, a break from reading text blocks, so they are perceived only by those readers who have time to decode these tools.
Compositional organization. The criterion by which we evaluate the combination of textual and graphical means on the covers. High compositional organization is inherent in the studied journals, because the volume of the text is expedient for perception. Visual complements the text with additional information or meanings, illustrates publications, attracts the attention of readers, while not spatially compressing text characters in order to allocate page space to insert illustrations. In magazines, the selection of visualization tools is made in accordance with the composition of the page and ease of perception. The sizes of visual forms are selected taking into account fields, the sizes of pages.
As part of the evaluation of this parameter, we present 6 typical schemes of placement of visual aids (layout), which are most common in the magazine «MAGMA» and «Suplement» (Figure 6).
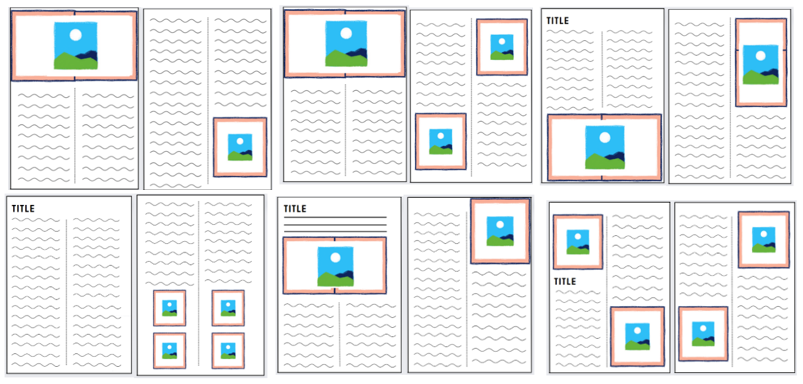
Fig. 6. Typical schemes of placement of visual aids (layout), which are most common in the magazine «MAGMA» and «Suplement». Source: Authors’ computation.
Supragraphemics (font variation). For the layout of student magazines «MAGMA» and «Suplement» use two basic fonts – for the title and for the main text. However, the magazine «Suplement» is characterized by the stability of fonts from issue to issue, which indicates the stylistic unity and a clear concept of the publication. Instead, the font palette for Magma magazine sometimes changes depending on the issue. The number of fonts for these magazines does not exceed three, with the help of different font types differentiate between text elements – headlines, main text, lines during interviews, quotes, captions to pictures. Therefore, we define the level of supragraphemics as high, because the font variation is aimed at ensuring the ease of reading and perception of publications and publications in general.
Topographemics (spatial placement of the text). MAGMA and Suplement magazines usually use multi-column layout (two-column text). Infrequent use of three columns («Suplement» magazine) and one column («MAGMA» magazine) for small text fragments – annotation to the article, editor’s address (editor’s word).
Non-pictographic, non-photographic elements. In both magazines there is the use of symbols, decorative lines to distinguish elements on the covers, pictures, which serve as a colored background for semantic accents, footnotes, quotes. Provide navigation and ease of use of the publication, complement the aesthetics of the composition of the footers with the colonnumber, created in the format of a symbol (magazine «Suplement»). The footer usually contains a line and a text marker – an indication of the heading or author of the publication. Thus, this parameter is characterized by the mark «active use».
Text positioning (selection, insertion). The layout of both editions is made taking into account the ease of reading for the audience. In editions for the main text there is a direct font, for headlines – bold, for quotes, semantic accents, lines in the interview – italics or a combination of italics and bold. There is also a color positioning of the font, the design of the titles of publications with a certain thematic color, which is harmoniously combined with the tones of illustrations on the cover. Thus, the positioning of the text in both student magazines is successful, as evidenced by the aesthetics of their compositional design and ease of perception and reading of the publication.
As a result of evaluating the parameters of visual communication efficiency in the magazines «MAGMA» and «Suplement» established its effectiveness and high level of activity in the use of visualization, diversification of image content, successful combination of supragraphemics, topographemics, text positioning with color and different font typefaces.
Conclusions
The monitoring and content analysis of visualization tools in student periodicals confirmed the relevance and trend of the use of pictorial content in periodicals. The popularity of visualization is due to the fact that it is a complex technology that affects readers on several levels. The complexity of this technology is the availability of various tools and instruments – typical forms of visualization (photographs, drawings, pictures, symbols, puzzles, comics, graphics, tables, etc.), font and compositional design, non-pictographic elements (color, inserts, decorative lines, etc.). And this whole complex systematically affects the audience, the readers of these publications. First, visualization affects the cognitive level. To do this, use such visual forms as photographs, which reproduce real facts, events, people; posters presenting real announcements about events; tables, graphs, charts, the purpose of which is to show readers the dependence of facts and data, certain trends, generalizations, to provide information for reflection.
Second, the affective level of visualization impact. Drawings, pictures, comics, puzzles, symbols, in addition to the existing coding of content, information basis, attract emotional factors of perception. Readers decode symbols, puzzles, trace the content of history in comics, evaluate the authors intentions in drawings, connect the pictures with the subject of the publication, and therefore use their emotional intelligence to effectively perceive such pictorial content. The aesthetics of these forms of visualization attract the attention of readers and stimulate the emergence of emotions.
Third, visualization affects the suggestive level. Demotivators are becoming a method of influencing young people with an open slogan – a call to action. Photographs depicting the characters of a publication or interview, accompanied by a textual presentation, can also motivate readers to act and succeed, creating a holistic image of a successful young person.
Fourth, the conative level is the effect of visualization. Comics and infographics present a certain story or thematic information plot, algorithm of actions, and give readers hidden ideas or motivations.
Active use of visualization is due to the advantages of its use and wide functionality. The functional purpose of visualization in student periodicals is the representation and formation of the image of students as active youth who uphold the values of their university. This function is implemented with the help of photographs that present reality, complement reporting materials and publications about students, successful graduates. Equally important is the identification and cultural function of visualization. The placement of high-quality and authorial pictorial content helps to build the brand, image of these universities, translation of values and traditions, corporate identity of universities, attracts the attention of readers and creates the aesthetics of the composition of these publications. In addition, any type of pictorial content clearly demonstrates the content of publications, promotes interest, mobilizes the sensory reaction of readers.
Thus, the specifics of the impact of visualization is complexity (the presence of real, imaginary, abstract groups of tools, visualization tools), systematic (continuity of the impact of visualization is achieved by appealing visual content on cognitive, affective, conative, suggestive levels; visual activity, availability of visual aids in each issue, the variety of visualization tools), the presence of criteria that ensure its effectiveness (visual activity, degree of cognitive perception, compositional organization, supragraphemics, topographemics, non-pictographic elements, text positioning), functional and situational depending on the form of use their functional purpose.
