
DOI:https://doi.org/10.34069/AI/2021.47.11.26
The role of lifestyle habits in the prevalence of overweight and obesity among students
Ali Almetrafe111
Abstract
The key objective of the present study is to explore the prevalence of being overweight and/or being obese using the body mass index (BMI). We investigated the relationship between lifestyle habits (sleeping patterns, dietary habits, physical activities, and screen times) and obesity. We used a cross-sectional study involving male students of medical and non-medical at the College of Medicine and College of Management and Economics at Saudi Arabia’s Qassim University. To gather data, a tailor-made, self-administered questionnaire was the tools of choice. The first part of the form collected a data pertaining to the height and weight of respondents. This measured BMI. Participants then categorized as underweight (BMI < 18.5), normal weight (BMI = 18.5–24.9), overweight (BMI = 25–29.9), and obese (BMI >30.0). The second part of the study involved questions about the participants’ lifestyle habits. To assess the significance of the questions, aChi-squared test was applied. We found that prevalence of being overweight and obese among medical students was (24.4%) and (19%) respectively. for non-medical students the prevalence of being overweight and obesity was (25.6%) and (16.5%) respectively. regarding dietary habits more than half of the students (54.2%) who had three meals or more have a positive relation with obesity. A positive relation was noticed between lack of physical activity and high BMI. Positive relation was found between high BMI and screen time. Regarding sleep hours more than half of the students spend 6-8 hours in sleeping per day.
Keywords: Body mass index, Lifestyle, Obesity, Qassim students, Saudi Arabia.
Introduction
Obesity can be described as a medical condition in which excess body fat builds up in the body and negatively impacts health and lowers life expectancy. Defined by a BMI (body mass index) of 30 or above (Nuttall, 2015) obesity rates have increased rapidly in many countries over the past thirty years and is now a major global health issue, with approximately 2.1 billion people estimated to be overweight or obese in 2013 (Nuttall, 2015). Recently, obesity has impacted societies at various levels (Hurt,Kulisek, Buchanan, &McClave, 2010). In many countries, it is now a major epidemic health issue and the fifth most likely cause of mortality (Hurt,Kulisek, Buchanan, &McClave, 2010). Research in the Arabian Gulf has found that many people there consume high quantities of fatty and calorie-rich foods, which increase the risk of obesity and high mortality rates. The prevalence of being overweight, obese, or severely obese in otherwise healthy Saudi Arabian children and teenagers (those between 5-18 years) is 23.1%, 9.3% and 2%, respectively. In recent years, the Kingdom of Saudi Arabia (KSA) experienced several rapid socio-cultural changes, the result in part of economic growth in the Gulf area (Khalil et al., 2018). This transformation has seen food choices and eating habits become ever more “Westernized,” which is thought to be a major factor in the increasing rates of obesity and being overweight. These socio-cultural adaptations followed the discovery of oil in the twentieth century and an economic upturn in the 1970s and 1980s correlates with the rise in obesity in the region (Al-Rethaiaa, 2010). For many people, fruit and vegetables have been replaced by animal products and processed foods in Saudi Arabia, which may be largely responsible for the rising prevalence of obesity and being overweight in Saudi children, teenagers and adults. For children as well as adults, obesity occurs when excessive fat gathers in adipose tissue and has a negative impact on health (Al-Qahtani et al., 2013; Musaiger, 2011).
Problem Statement
Although there is an elevated risk of Saudi Arabian citizens experiencing cardiovascular diseases, there is little information about the relationship between these conditions and the dietary and exercise habits of Saudi students (Al-Kutbe Payne Looy&Rees, 2017). There are, certainly, numerous sedentary habits that contribute to obesity, including lack of physical activity in younger generations and unhealthy dietary habits, but such habits affect every demographic, from children to university students to adults across KSA (Al-Kadi et al., 2018), and this research will be undertaken to discover how they relate to students particularly. National public health authorities need to promote awareness about the advantages of regular physical activity to help prevent chronic illness and to improve the health of the people, and perhaps particularly university students (Al-Hazzaa & Musaiger, 2011).It has been found that dental students are especially prone to obesity as a result of lifestyle, which often involves limited physical activity and unhealthy eating habits. This puts dental students at a heightened risk of developing obesity-related health conditions. Thus, further research is crucial, with a particular focus on medical students (Habib et al., 2017). Mehmood et al. (2020) say that medical students are some of the most intelligent and health-conscious people in the country but there is little research which has explored the prevalence of obesity amongst medical students in particular in KSA. It is for this reason that this study investigates weight-related health issues of university students in the Qassim region and expected to contribute to improving the quality of life according to the objective 13 (Improve public health services with a focus on obesity and smoking) in Saudi Arabia’s Vision 2030 (National Transformation Program, 2016). In addition, a comparison of BMI measures among medical and non-medical students at Qassim University and their impact will help to reveal any association between lifestyle habits (sleeping patterns, dietary habits, physical activities, and screen times) and obesity.
Hypothesis:
- Lifestyleis associated positively with obesity.
- Screen time is associated positively with obesity.
- Physical activity is associated positively with obesity.
- Sleeping patterns are associated positively with obesity.
- dietary habits are associated positively with obesity.
Objectives
The research seeks to achieve the following objectives and sub-objectives:
- To determine the relationship between lifestyle and obesity among medical and non-medical students.
- To determine the relationship between screen time and obesity among medical and non-medical students.
- To determine the relationship between physical activity and obesity among medical and non-medicalstudents.
- To determine the relationship between sleep patterns and obesity among medical and non-medicalstudents.
Literature Review
Obesity is a primary cause of mortality and morbidity throughout the Gulf region, bringing a huge economic burden to national health authorities. It is also a contributing factor in heart disease and other chronic diseases such as hyperlipidemia, hyperinsulinemia, heightened insulin resistance, tension and early atherosclerosis. Furthermore, obesity negatively impacts metabolism, raising blood pressure and cholesterol levels. The risk of stroke, type 2 diabetes, atherosclerosis, gallbladder disease, hypertension, kidney failure, and a multitude of cancers (especially breast cancer) has also increased (Alissa, & Ferns, 2011). It is well known that both genetic factors and lifestyle choices contribute to the onset of obesity. These include lack of exercise, poor sleeping and eating habits, and too much time watching screens (Chaput & Dutil, 2016).
Recent research of Saudi Arabian children between 10-19 years shows a significant positive relationship between drinking sugary drinks and poor dietary habits (Al-Qahtani, 2016). In an international comparative study, it was found that Arab countries have the lowest number of college children who walk or cycle to college. Al-Qahtani (2016) since lack of exercise correlates with childhood obesity, a low level of physical activity in children calls for a strategy to address childhood obesity and encourage physical activity. Governmental and nongovernmental agencies need policies and programs to combat obesity and to promote active living for all citizens in the Gulf (Al-Hazzaa & Musaiger, 2011). Furthermore, extreme outdoor temperatures in Arab countries mean that forestation and vegetation are relatively sparse, providing few outdoor environments in which people can exercise. Such conditions encourage people to stay inside or travel in vehicles, even for short journeys that lead to physical inactivity and lack of exercise. What is more, traditional and cultural conditions in Gulf countries generate increased obesity rates for females. This is because girls and women are restricted from engaging in sports or physical exercise. Additionally, cheap migrant labour handles most strenuous household chores, with many families in Kuwait and Saudi Arabia employing chefs and maids, which means that many girls and women there lead sedentary lives (Zaman, 2016).
Although the World Health Organization (WHO) says that obesity tends to be more prevalent in females than males, research into college students shows higher obesity rates in males than in females (Al-Rethaiaa, 2010). However, research focusing on males has found that their most common eating habits were to eat two meals a day (including breakfast) with the family, and to eat snacks and fried foods in between. A majority of male students reported eating no fruit or vegetables, except for the frequent consumption of dates. Furthermore, college students (who are representative of the younger population) are more likely to eat junk foods for a variety of reasons. They show poor eating habits throughout their university lives, which ultimately impact their health, increasing the likelihood of obesity, diabetes and coronary heart disease (Khalaf et al., 2015). Moreover, along with low vegetable and fruit consumption, there is a lack of physical activity since they spend increasing amounts of time watching TV or using a computer (Mohamed & Mohamed, 2019; Al-Qahtani, 2016). In 2017, Mishra et al. and Kunovski, &Pomortseva (2021) discovered a high prevalence of sleep deprivation in their research that was significantly related to an increased risk of obesity in medical students (Mishra et al., 2017). Since adolescents generally and university students in particular have poor lifestyle patterns, such as unhealthy food choices and a sedentary lifestyle, this study aims to investigate the relationship between lifestyle patterns and obesity among students at Qassim University. Understanding the various factors that promote body satisfaction across racial and ethnic groups is important since it may facilitate adopting healthy lifestyle behaviours, improve effective obesity prevention interventions, and prevent body weight dissatisfaction and eating disorders.
Research Methods
Design and Sample:
This study was based on a quantitative approach and a cross-sectional study was conducted among medical and non-medical students. The participants are male college students enrolled in the College of Medicine and the College of Economics and Administration, Qassim University, Saudi Arabia. The data was collected from September until December 2019.For each college, the sample size determined in such a way to ensure that the sample proportion is within ± 0.05 of the colleges population with a 95% confidence level. At Qassim University, the population of male students in the College of Medicine and the College Economics and Administration is 431and 1760, respectively (2019). In the present study, the sample was determined by applying the Taro Yamane (1973) formula at a confidence level of around 95%and the formula is as follow sn=N/(1+N(〖e)〗^2 ). For male medical and non-medical students studying at the bachelor level, there is a minimum required sample size based on the Yamane formula, which was 204 and 302, respectively. A multistage stratified random sampling process was applied to select 204 students from the medical college and 302 students from the college of economics and administration at all levels of study.
Data Collection
To gather the necessary data, we used self-administreted questionnaires and anthropometric measurements. There are three sections to the questionnaire, the first focusing on collecting demographic details such as age, sex, education level and college. The second is concerned with recording the measurements and anthropometric variables (i.e. body weight and height). The assessments was taken a place in the morning and trained researchers applied standard procedures. Height and weight measurements was recorded using standard techniques (Magbool, 1993). A measuring tape measured each student’s height; the subject standed back-to-back against the wall, with heels, buttocks and shoulders pressed again the wall. Measurements were made to the nearest 0.1 cm. Normal scales was used to measure weight. During the weighing process, the students were barefoot and wear light clothes. Weight measurements was taken to the nearest 100 g. We used the following formula to calculate the Quetelet index or BMI:
BMI= Weight (kg) ⁄ height2 (m)
To identify each student’s weight status, body mass index categories must was set up. In accordance with the BMI measurements, the National Institute of Health categorizes adults as follows: underweight (BMI < 18.5), normal (BMI = 18.5-24.9), overweight (BMI = 25-29.9), or obese (BMI ≥30) (National Institutes of Health, 1998) The third section collected data about lifestyle habits (such as sleep patterns, dietary habits, physical activities, and TV/computer time). The questionnaire for this research has been modified from a previously validated questionnaire (Habib et al., 2017; Al-Sendi, et al 2002; Alshareef et al., 2021).
List of variables
Independent variables: sleep patterns, dietary habits, physical activities, screen time, medical and non-medical students. Dependent variable: Body mass index.
Ethical Consideration
The College of Medicine Ethical Committee at Qassim University provided ethical clearance and approval for carrying out the field research. Questionnaires were administered with a cover letter giving the study’s instructions, rationale, and research objectives. A consent form, which was completed, will also been supplied. This document was handed out in person to a sample selected via convenience sampling.
Data entry and analysis
The data collected from the questionnaires was transferred and placed in a data set on a computer. The data was analysed using SPSS (the statistical package of the social sciences) version 21. regression analysis and correlation analysis identified any relationships between age, weight and BMI. To check for differences in or relationships between categorical variables (such as BMI and other factors), we used both a Chi-square test and t-test. If the p-value is less than 0.05, the value will be accepted as statistically significant.
Data management
Paper documents such as consent forms or questionnaire sheets was stored securely in locked filing cabinets when not in use and accessed only by the researchers during the study.Results
Table 1
Socio-demographic characteristic of the participants.
BMI:Body mass index
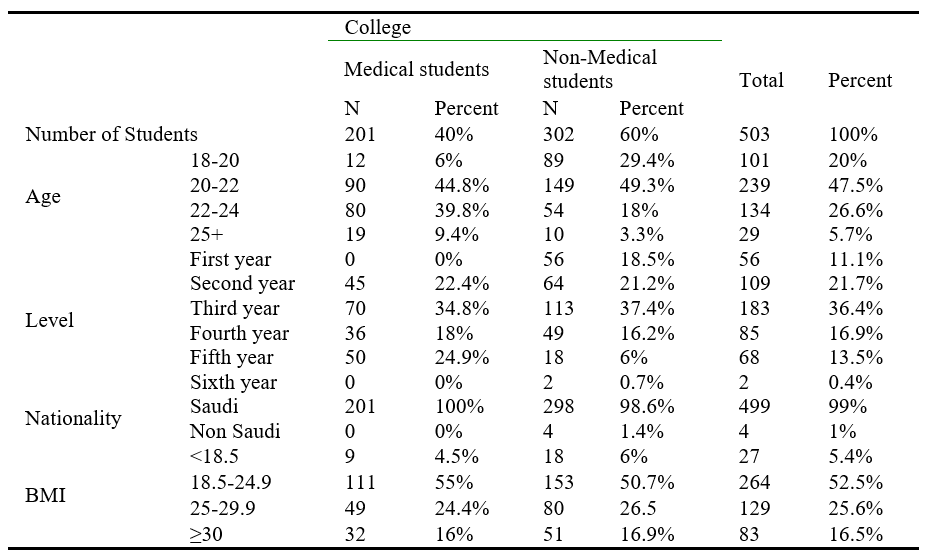
Socio-demographic characteristic of the student that participated in the study are given in table 1. A total of 503 male medical and non-medical student participated in the study. The percentage of non-medical student in the sample has exceeded that of medical student (60% versus 40%). There were no significant difference in age distributed between medical and non-medical student. Almost half of the participant (47.5%) were of 20-22 years old. And more than third of the participant (36.4%) were in the third year. Almost all of the students are Saudi participants (99%) only 1% are Non-Saudi participants. All medical student participants are Saudis (100%). A percentage of 1.4% corresponds to the Non-Saudi students from the Non-Medical students. The measurements of BMI showed that most of the students (52.5%) had normal weight. Overweight and obese students were 25.6% and 16.5% respectively. Underweight students were 5.4%. Percentage of underweight students in both groups is low (4.5% and 6%) compared to overweight and obese students. Percentage of overweight students in both groups (24.4% and 26.5%) is more than the obese students.
Table 2.
Participants’ response for dietary habits, physical activities, screen times and sleep patterns questionnaire.
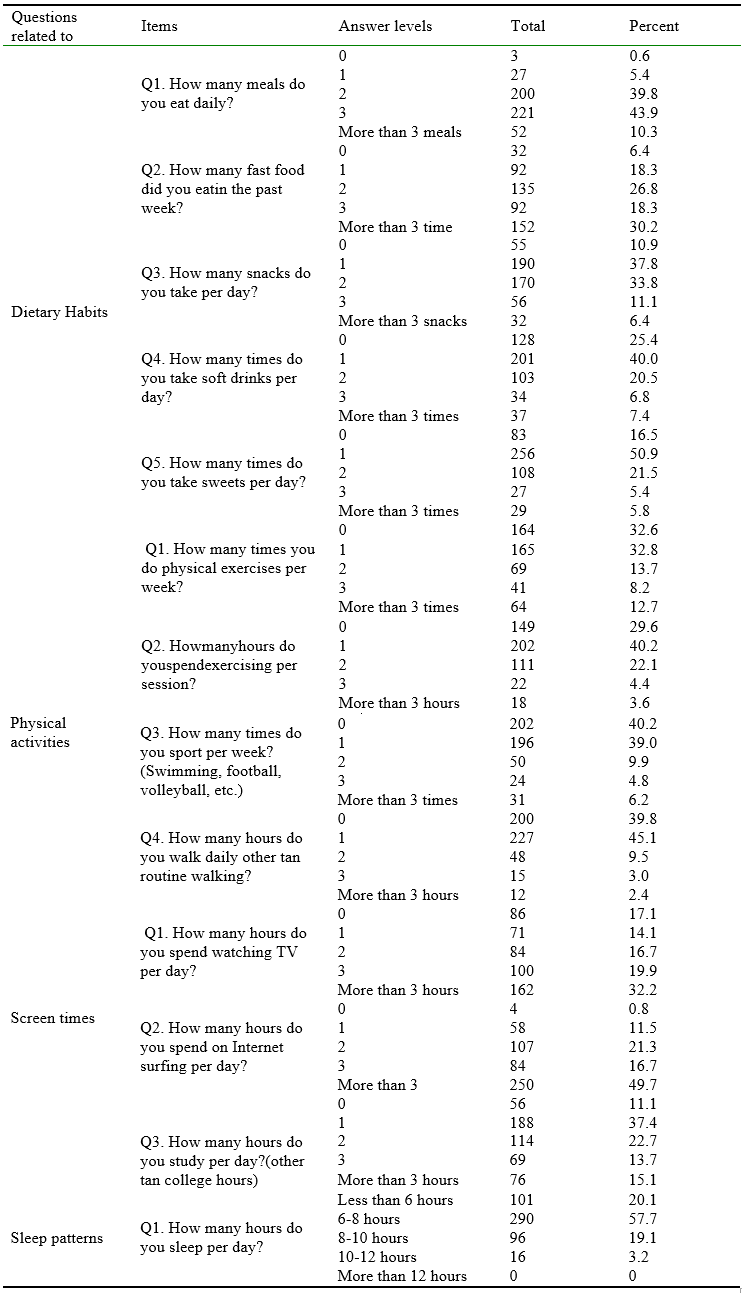
Out of 503 participant the vast majority of them had three meals per day 221 (43.9%) and 200 (39.8%) had two meals per day. fast food consumption more than three times a week was the highest among participant 152 (30.2%), and the second common finding 135(26.8%) had to fast food meals per week. The highest percentage of students 190(37.8%) had only one snack per day and students whom took two snacks were 170(33.8%). The majority of students 201(40%) had one soft drink per day and the second most common finding was never having any soft drink 128(25.4). the vast majority of student had only one sweet per day 256(50.9%). Regarding physical activity, most of student exercise once a week 165(32.8%). The second most common finding 164(32.6%) never exercise. Student whom exercise, most of them spend one hour per session 202(40.2%). We found that the majority of participants don’t do any type of sport 202(40.2%) and 196(39%) do sports once a week. Most of participant 227(45.1%) spend one hour on walking other than routine. Response to questions related to the screen time show most of participants that watch TV spend more than 3 hours per day and they represent 32.2% of all participants. On the other hand, less common sample that don’t watch TV represents 17.1%. A sample taken for participants regarding internet surfing per day show, most of the participants spend more than 3 hours and they represent 250 (49.7%) and the 2nd most common spend 2 hours and they represent 107 (21.3%). Of the 503 students participated in the study about how many hour study per day other than college hour, 188 students (37.4%) spend 1 hour, other students that don’t study represent 56 (11.1%). Questions asked about how many hours sleep per day, 290 (57.7%) spend 6-8 hours per day and they represent the majority, and the students that sleep 10-12 hours per day 16 (3.2%) and represent the minority.
Table 3.
Comparison between groups of medical and non-medical students .
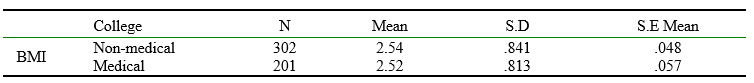
Table 4.
Independent Samples t-test.
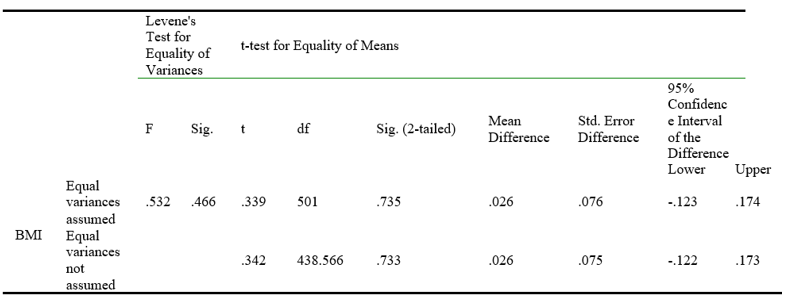
An independent-sample t-test was conducted to compare the mean BMI between the groups of medical and non-medical students. There was insignificant difference in the score of non-medical students (M=2.54, SD= 0.841) and medical students (M=2.52, SD= 0.813), t(501)=0.339, p=0.735.
Table 5.
Association between BMI category and lifestyle habits (dietary habits, physical activities, screen times and sleep patterns)
.png)
The analysis of the relation between students BMI and dietary habits, physical activity, screen time and sleeping pattern is shown in Table 5. More than half of the student (54.2%) take 3 or more meals per day and deference was statically significant (p=0.047). The number of fast food consumption in the past week of the participants show a significant association (p=0.045) also, as (48.5%) of participants eat three meals or more, and the obese students represent the largest percentage of them. The number of snacks per day has strong statically relation (p=0.000) and we observe that consuming snacks in obese students are markedly increase, as (31.3%) of obese students eat 3 snacks or more. In contrast (22%) of underweight, (14.7%) of normal weight and (13%) of overweight students whom eat three snacks or more Soft drinks consumption per day are highly linked to BMI too (P=0.000). As the percentages of underweight (3.7%), normal weight (4.1%) and overweight (4.6%) of students whom dinks more than three times are less than obese (22.9%) which make soft drinks consumption involve in increase BMI. The number of times of sweat taking per day show that 56 students whom take sweats three times or more and (46.4%) of them were obese. There was also significant relation between the physical activities and BMI. 32.6% of the students never do exercise in the entire week and about 32.8% exercise only once in the week and only 12.7% of the student do exercise more than 3 times per week (p=0.000). We observe that hours spent on exercising per session has a relatively association with BMI. As 152 participants were exercise two hours or more per session and (69.7%) of them were underweight or normal weight. In the other hand, (30.2%) of the 152 participants were overweight or obese, which mean that overweight and obese spend less time in exercising per session. Most of the participant (79.1%) do sports maximally once per week and 17.6% of them are obese students with no statically significant relation with BMI(p=0.611) We also observe that 84.9% of the participant walk one hour or less on the entire day, 52% of them are normal weight students and the obese students represents only 17 % and only 15% of the students walk three or more hours per day and out of the 15% students the obese participant represent only 0.5% with statically significant relation (p=0.01). We found that only 12.3% of the students spends less than two hours on the internet daily and about 66.4% spends three or more hours. Out of this percentage, the normal weight students represent 52.1% whereas the obese students are only 19.2% with statically significant relation. In this study we noticed that the number of study hours per day has no significant relation with the BMI.48.5% of all participants spends less than two hours on study per day and more than half (50.1%) of them are normal weight students whereas the obese students represent 17.9%. We find no significant relation between the number of hours spent on watching TV and BMI. 32.2% of the student watch TV more than 3 hours per day and half of them are normal weight students whereas the obese students are only 21%. In contrast only 17%of the participant that do not watch TV in the day (p=0.288). Question asked about how many hours do you sleep per day, the majority of the student (57.7%) spends 6-8 hours in sleeping per day and there was no statically significant relation (p=0.444) .
Dietary habits
Obesity has impacted societies at various levels (Al-Qahtani et al., 2013) dietary habits and consumption of high quantities of fatty and calorie-rich foods, which increase the risk of obesity and high mortality rates. The vast majority of our sample were normal weight (52.5%) BMI (18.5-24.9) and only 16.5% were obese BMI (≥30). Number of meals per day was one of the important parameters for this study. Interestingly, we found that the majority of our sample have three meals daily which was the most common finding across all weight classes. We also found that (66.2%) of obese students had three or more meals per day and (53%) of the normal weight student whom have three or more meals per day. There is positive statistical relation between the number of meals per day and the obesity. On other study was conducted on in College of Health Sciences at Alrass, Qassim University, KSA, they found that majority of their students had two meals per day (Al-Hazza & Musaiger, 2011) Interestingly, they found that the majority of their students whom had three meals per day were normal weight (20.2%) followed by over weight (5.3%) then obese (4.5%) (Nuttall, 2015). On a study was conducted at the College of Dentistry, King Saud University, and they found that the majority of their obese sample had three meals per day and the majority of their normal weight sample had two meals per day (Hurt et al., 2010). We think that variation of results in which some case of the normal weight sample had more meals per day than over weight and obese is a prove that the number of meals is not the only factor but other factors like quantities, macros, and metabolic rate should be taken into consideration (Musaiger et al 2011).
The second parameter was the fast food consumption per week. It is well known the effect of fast food on the weight and non-communicable diseases. We found that the majority of obese participants (42.16%) had more than three fast food meals per week and the majority of the normal weight participants (31.43%) had only two fast food meals per week. There is positive statistical relation between fast food consumption and obesity. In a study was conducted at University of Dammam, they found that( 24%) of the sample consumed fast food regularly but they did not find any statistical relation (Al-Kadi et al., 2018) in study conducted in a public university in Kuala Lumpur the found that 640(68%) of their sample skipped breakfast and consumed fast food regularly (Khalil et al., 2018). Furthermore, they have found positive statistical relation between obesity and fast food consumption (Khalil et al., 2018).
One of the important factors that contribute in obesity is number of snacks consumed per day. In our study we found that only 14.7% of the normal weight students takes three or more snacks per day, in contrast, 31.35% of the obese students consumed three or more snacks per day. These data show a statically significant relation between number of snacks taking per day and obesity(p=0.001) (Nuttall, 2015). Another study was conducted on College of Dentistry, King Saud University, found that 10.9% of the normal weight students have three or more snacks per day and only 15.8% of the obese students have three or more snake per day with no statically significant relation.
Another important factor contributes in obesity is drinking soft drinks and it is one of the important variables in our study. We found that only 30 (11.3%) of normal weight students have three or more soft drinks per day. On the other hand, 26 (31.3%) of the obese students take three or more soft drinks per day which says that, there is a positive relation between the number of times taking soft drinks and obesity (Nuttall, 2015). A similar study was conducted on the College of Dentistry, King Saud University, found that 33.9% of the obese students take three or more soft drinks per day and only 18.3% of the normal weight students take three or more soft drinks per day.
Another parameter was taken into the consideration in our study is the number of times having sweets per day. We found that about half of the participated students (50.6%) across the all weight classes have sweets one time per day. And we found that (50.9%) of obese student have sweets more than one per day whereas of (29.9%) of the normally weight student. There is positive statistical relation between the number of times of having sweets per day and obesity. In a study was conducted at the College of Dentistry, king Saud University, they found that percentage of eating sweets is higher for the overweight and obese students in comparison with the normal weight students (Nuttall, 2015).
Physical activity
Number of physical exercises per week was also one of the important parameters in this study. Studies show that lack of physical activity is currently categorized as one of the fundamental public health problems worldwide (Khalil et al., 2018). one of the major influencing factors that could impact the health of the person and considered one of the leading causes in the no communicable diseases is the physical inactivity (Nuttall, 2015).In our study, we found that the majority of the participants across all weigh classes are either physically inactive (32.6%) or exercising once (32.8%) per week. Almost, most of obese students (83.1%) are physically inactive or exercising one time per week and only (16.9%) of them exercising more than 1 time per week. Whereas, the normally weight students (60.2%) of them are physically inactive or exercising one time per week and (39.8%) of them exercising more than 1 time per week. There is positive statistical relation between the number of physical exercise per week and the obesity. In a study was conducted at University of Dammam, they found that (58%) of the sample exercising less than one time per week (Khalil et al., 2018). In another study was conducted at the College of Dentistry, king Saud University, they found that the percentage of obese and overweight students exercising less times as compared with normally weight students (Nuttall, 2015).
In this study there is high association between hours spent on exercising per session and BMI. We found about (36%) of participants with normal BMI exercise two hours or more per session, in contrast, (16.9%) of obese participants exercise two hours or more per session. On a study was conducted at the College of Dentistry, King Saud University, they found that (1.8%) of the obese students and (37.5%) of student with normal weight spend three hours or more of exercising per session (Al-Hazza & Musaiger, 2011) the second parameter was the number of times of sports per week and we found that (23%) of normal weight and (15.6%) of obese participants play sports two times at least per weak. A study conducted on (215) female medical students at University of Dammam, Kingdom of Saudi Arabia shows that (33%) of normal weight and (23%) of obese students do sport two times at least per week (Khalil et al., 2018). So, the relation between number of times of sport per week and BMI is an inverse relationship, which means that increase number of times of sport per week will decrease BMI. The last parameter of physical activity used in this study is hours of daily walk other than routine walking which shows a positive relation. We observed that (61.4%) of normal weight and only (45.8%) of obese participants walk at least one hour per day. The result of our study revealed that obese participant are less physically active.
Screen time
The internet has become an essential part for every one’s life and more importantly adolescent and university students. Unfortunately, the time was spent on internet reduced the free time for exercise and shifted them toward sedentary life style. A sample was taken regarding internet surfing per day shows that most of the participants spend more than three hours represents 250 (49.7%) and most of them have (126) normal weight. We also found that 16.7% of the sample spent three hours surfing the internet and the majority of this percentage (57.1%) have normal weight. There is statistical relation between hours of surfing internet and obesity. We found that there is no association between number of hours watching TV and BMI (P value= 0.288). There are 128 non-obese students spend more than 3 hours per day watching TV and only 34 obese students spend more than 3 hours per day. Some studies found that there is an association between number of hours and being overweight or obese. One of these studies was conducted among students of Dentistry College at king Saud University; they found that about 43% of the obese students spend more than 3 hours per day on screens and internet (Nuttall, 2015).
This study has provided information about the effect of study hours (other than college hour) on weight. Of the 503 students participated in the study, (15.1%) of participant spent three hours or more studying and (48.6%) of these students have normal weight. The vast majority of the sample who spend one hour studying per day represent (37.4%), (14.8%) of them are obese and (51.5%) of them have normal weight. n study was conducted at college of dentistry, king Saud university, they found that more than half of students participated in the study were not exercising due to the lack of time spent on studying and they thought that academic stress and curriculum overload are major factors for development of overweight and obesity (Nuttall, 2015). In our study there is no associations between studying hours and obesity (P value= 0 .703).
Sleep pattern
The reason of this study was to assess overweight and obesity rates and to correlate it with sleeping hours. Sleeping hours are important element in preserving and implementing healthy life style and weight. Student whom sleep 6-8 hours represent the majority (57.7%), (54.1%) of them have normal weight and (14.8%) of them are obese. Students whom sleep 10-12 hours represent 16(3.2%), most them have normal weight. In our study there is no associations between sleeping and obesity (P value = 0.444).Conclusion
From the result of the study, we can conclude that the prevalence of being overweight and obese among medical and non-medical student is high. We found that there are strong associations between dietary habits and physical activity with the increase of weight. Overweight and obese students were found to be less physically active and tend to have snacks, soft drinks and sweets more than the normal weight students. The awareness about the consequences of obesity and the benefits of the exercise and healthy diet must be increased among the students