
DOI:https://doi.org/10.34069/AI/2021.47.11.11
Methodology for rationing the fuel consumption of the PAZ-320412 bus
Методика нормирования расхода топлива автобусов ПАЗ-320412
Daba Nimaevich Radnaev50
Abstract
The article analyzes suburban bus transportation with specific routes in the Republic of Sakha (Yakutia). For the experimental study, the route No. 101, «Yakutsk – Tabaga» with a total length of 31 km was chosen. The schedule of buses of Municipal Unitary Enterprise «Yakut Passenger Transport Company (YAPAK)» on the suburban route is shown. The basic technical data of the bus PAZ-320412 was studied. In accordance with international regulations for the buses, the determination of fuel consumption and specific emissions of normalized toxic components is carried out using a riding cycle on running drums. For the calculation of fuel consumption, the technique of modeling of indicators of work of the engine which provide change of traction and speed characteristics of the car according to the set driving cycle was used. Finally, the results of the calculated fuel consumption for the NEDC driving cycle are compared with experimental data. As a comparison of the calculated and theoretical fuel consumption data with practical data, the Cummins engine type Cummins ISF 3.8 is considered. This internal combustion engine is installed on a PAZ-320412 bus. Experimental data on the fuel consumption of this bus per 100 km. showed 48 nm3, and theoretical calculations of bus fuel consumption per 100 km. by the proposed method showed 42 nm3. Therefore, to assess the traction and speed properties of the bus, the proposed combined method can be used which allows one to obtain calculation of fuel consumption which is closer to the experimental data on a driving cycle. Using the source data of the vehicle, effective engine performance indicators are evaluated. A calculation method is proposed for modeling a test, and experimental driving cycle of automobile transport with a total mass of more than five tons is suggested.
Keywords: acceleration, deceleration, driving cycle, experiment, fuel consumption, suburban buses.
Аннотация
В статье анализируются пригородные автобусные перевозки по конкретным маршрутам в Республике Саха (Якутия). Для экспериментального исследования был выбран маршрут № 101 «Якутск - Табага» общей протяженностью 31 км. Приведено расписание движения автобусов МУП «Якутское пассажирское транспортное предприятие (ЯПАК)» на пригородном маршруте. Изучены основные технические данные автобуса ПАЗ-320412. В соответствии с международными правилами для определение количества топлива и удельные выбросы нормированных токсичных компонентов осуществляется с использованием ездового цикла на работающих барабанах. Для расчета расхода топлива используется методика моделирования показателей работы двигателя, обеспечивающих изменение тягово-скоростных характеристик автомобиля в соответствии с использовался установленный ездовой цикл. Наконец, результаты расчетного расхода топлива для ездового цикла NEDC сравниваются с экспериментальными данными. При сравнении расчетных и теоретических данных о расходе топлива с практическими данными, рассматривается двигатель Cummins типа Cummins ISF 3.8. Данный двигатель внутреннего сгорания установлен на автобусе ПАЗ-320412. Экспериментальные данные по расходу топлива на этом автобусе на 100 км. показал 48 нм3, а теоретические расчеты расхода топлива автобуса на 100 км. по предлагаемому способу показал 42 нм3. Таким образом, для оценки тягово - скоростных характеристик автобуса может быть использован предложенный комбинированный метод, позволяющий получить расчет расхода топлива, более близкий к экспериментальным данным по ездовому циклу. По исходным данным автомобиля оцениваются эффективные показатели работы двигателя. Предложен расчетный метод моделирования испытания и экспериментальный ездовой цикл автомобильного транспорта общей массой более пяти тонн.
Ключевые слова: ускорение, замедление, ездовой цикл, эксперимент, расход топлива, пригородные автобусы.
Introduction
In the long term, bus transportation remains the main type of passenger transportation for most cities and towns of the Russian Federation and is of great social importance. In the city of Yakutsk, about 100% of the total passenger traffic is carried out by ground transport - buses. Of these, city bus transportation has accounted for 94% of traffic in 2018.
Improving the efficiency of enterprises, operating city buses can be carried out by increasing fuel efficiency, in which the issues of rationing fuel consumption by city buses plays a paramount role.
In connection with the abovementioned data, studies related to determination of route fuel consumption rates is based on the development of a method of fuel consumption standardization for PAZ-320412 buses are relevant.
A distinctive feature of the work of buses on city routes is a change in the degree of filling of buses with passengers, different distances between stops, a large number of stops, braking and acceleration, passage of regulated and unregulated intersections, etc. Practice shows that in urban conditions, the modes of movement of a shuttle bus are significantly different from the modes of movement of a conventional car. It’s enough to note that the number of brakes per km of the path is 1.35 times more than that of the driver, clutch disengages — 2.48 times, and forced stops — 1.54 times. A significant difference in operating conditions is observed both between the route network of several bus depots, and within one fleet (Sumatohin, 2012).
For buses, in accordance with international regulations, the determination of fuel consumption and specific emissions of normalized toxic components is carried out using a driving cycle on running drums.
At the stage of preliminary selection of optimal parameters of the engine, the rational is the mathematical modelling of the work in conjunction with the car in the driving cycle.
Due to the high cost of equipment for the experimental implementation of a test driving cycle on running drums, the need often arises for mathematical modelling of this cycle.
Theoretical framework
A theoretical study examines the fuel consumption of a bus PAZ-320412. They are designed to transport passengers in operating conditions corresponding to categories I, II, III (except for mountainous terrain) at ambient temperatures from minus 45° C to plus 40° C and relative humidity up to 75 % at 15° C. Body- all-metal, wagon layout, 2 entrance doors with emergency buttons. The model was launched into mass production in 2012.
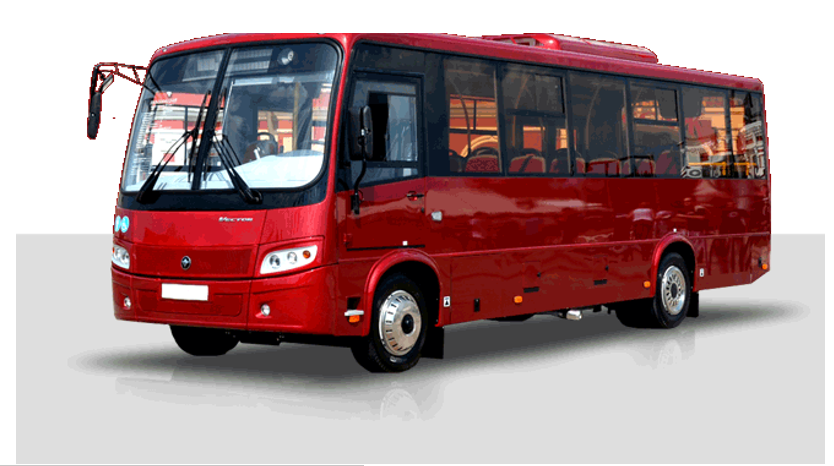
Figure 1. General view of the PAZ-320412 bus.
There are two versions – for city and suburban routes. The main areas of application are intra-city routes and corporate transportation. Cabin can have 4 different types of arrangements-15, 21, 24, 29 seats. The total capacity is 52-60 people. The driver's seat can have an individual door. The driver's seat has a seat belt which can be adjusted according to the angle of inclination, the height of the headrest, the distance to the steering column and the height of the pillow.
The bus is powered by a Cummins ISF 3.8 engine- a gas variant with six cylinders, providing up to 197 horsepower. It has a six-speed automatic transmission of brand Allison (Sumatohin, 2012).
With a total weight of 11.5 tons, the bus can reach a speed of 100 km / h. In terms of environmental friendliness, the bus complies with Euro-5 class. The volume of the gas cylinder is 62 liters. According to the manufacturer, the control fuel consumption of the PAZ-320412 bus is 24 litres / 100km. However, the experience of operating the PAZ-320412 bus in the conditions of the bus fleet of the MUP “YAPAK” speaks of other indicators of the route fuel consumption by this rolling stock.
Methodology
Since 1955, a bus fleet has been operating in the city of Yakutsk under the name «Yakut Passenger Vehicle Management» - YAPAK.
In the YAPАK there were not only buses, but also cars (M-20) and the so-called GAZ-51 cargo taxi. The company also had branches in Lensk and Aldan. Buses of the brandZIS-155, later PAZ-651, ZIL-158, ran around the city.
The company produced on the city line up to 200 buses per day, performing 18 city, 7 suburban and 4 country routes. Currently 70 buses of the Municipal Unitary Enterprise «Yakut Passenger Transport Company (YAPАK) » serve 7 suburban, 2 city and 3 country routes. However, the plans of the Yakutsk city administration include the further development of municipal transport.
The company's buses travel along 7 suburban routes:
- route number 101, Yakutsk - Tabaga with a total length of 31 km;
- route number 102, Yakutsk - Magan with a total length of 24 km;
- route number 103, Yakutsk - Khatassy with a total length of 17 km;
- route number 104, Yakutsk - Kangalassi with a total length of 40 km;
- route number 105, Yakutsk - Tulagino - Kildyamtsy with a total length of 27 km;
- route No. 109, Yakutsk - Zhatay - Zakharovka with a total length of 21 km;
- route number 111, Yakutsk - Zhatay with a total length of 19 km.
For the experimental study, we chose route No. 101, Yakutsk - Tabaga with a total length of 31 km. In figure 2, the red line shows the route diagram with bus-stops between Yakutsk to Tabaga.
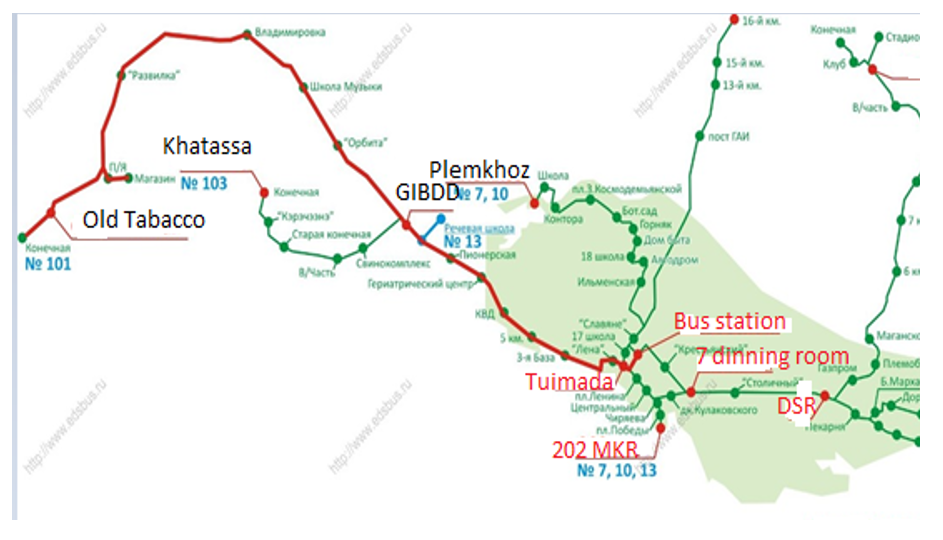
Figure 2. Diagram of the route with bus stops between Yakutsk - Tabaga.
Table 1.
Shows the bus schedule for Municipal Unitary Enterprise«YAPAK» along the suburban route.
 along the suburban route.png)
Table 1. In this route, PAZ-320412 buses are operated in a total of 6 numbers. Buses make 3 trips in one day, and the average daily mileage of one bus is 93 km.
To accomplish this task, we used a methodology for modelling engine performance indicators, which provide a change in the traction and speed characteristics of the car in accordance with a given driving cycle (Andryukhina O.S. (2006) & Andryukhina O.S. (2005). Simplicity differs from other models in combination with high convergence of the calculated and experimental results.
The initial data for the mathematical model of the riding cycle can be divided into the following groups (Filipkovskiy A.I (1988).
- Constant vehicle parameters: gear ratios gearboxes (for direct transmissions) uk1, uk2, uk3, and uk4; full mass of automobile ma.kg; gear ratio of the transfer case upb (if there is no transfer case, then upb = 1); final drive ratio u0; static wheel radius rst.m; the coefficients for constructing VSHD A1, A2 [1]; the coefficients of the total road resistance yд; Vehicle transmission efficiency hт; air resistance coefficient K, (N×с2)/м4; vehicle height Br.m; vehicle width Hr. м; coefficients of filling the frontal area of the car aА (Lukanin, & Trofimenko, 1996).
- Constant engine parameters: fuel density rт, kg/м3; rated engine power Ne_nom, kW; rated engine speed nnom, min-1.
- Parameters of the test mode: number of gear iu; vehicle speed v, km / h.
- Engine output parameters: specific effective fuel consumption in the ge mode, g/(kWh).
- The scheme of the test cycle, that is, a given time sequence of changes in the parameters of the test mode.
For the study, the European NEDC driving cycle was selected. The choice of this cycle is due to the fact that the CIS countries, including Russia are guided by the EU standards in the development of standards for determining and standardizing the toxicity of motor vehicles, the current driving cycle is starts from 2000 NEDC.
The NEDC cycle consists of four successive ECE 15 urban driving cycles and one EUDC suburban driving cycle following one after another. The diagram of these cycles are presented in Fig. 3,4, and 5.
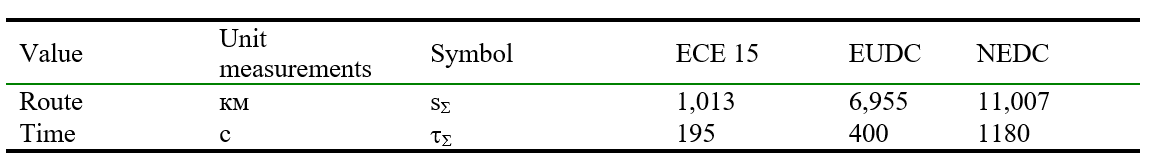
The main indicators of the NEDC driving cycle are also given in table 2.

Fig. 3. Diagram of urban driving cycle ECE 15
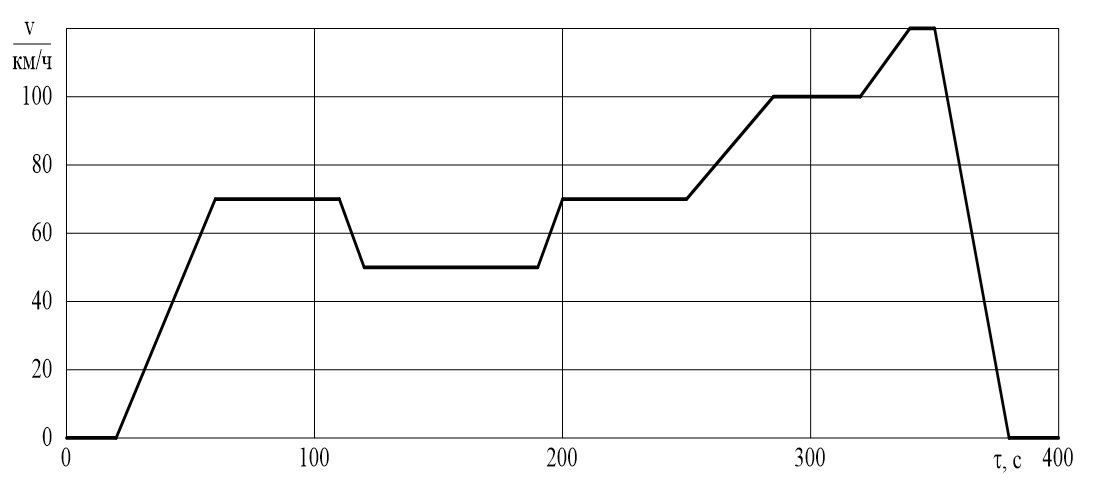
Fig. 4. Diagram of EUDC driving cycle.
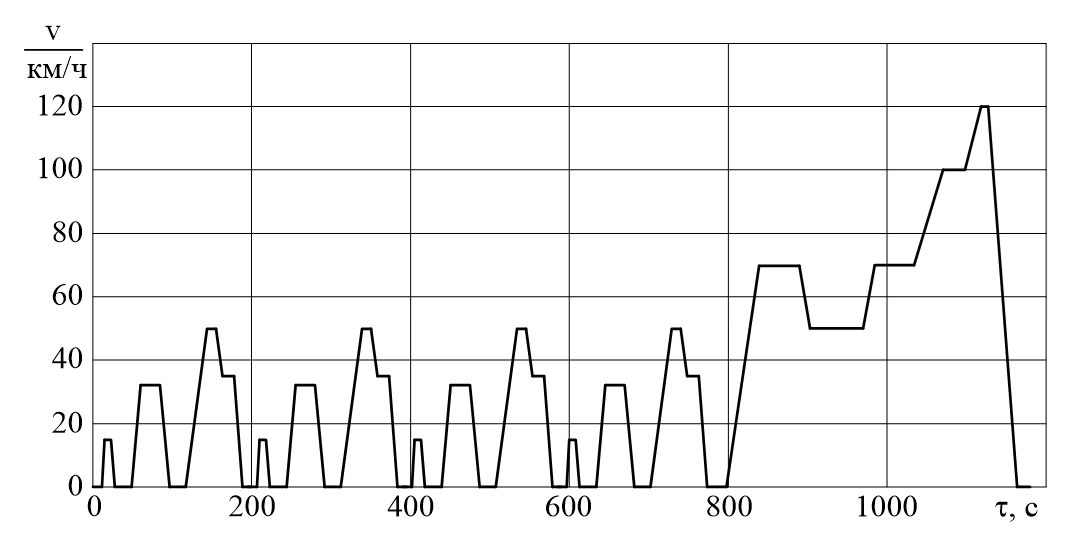
Fig. 5. The diagram of the combined driving cycle NEDC.
Table 2.
Key Performance Indicators for the NEDC Driving Cycle.
Results and discussion
A distinctive feature of the technique proposed in (Gasparyants, 1978) is to simplify the design study, the driving cycle is divided into sections, into which the parameters of the test mode do not change. Thus, the transition mode, during which the car moves with acceleration or deceleration is divided into elementary quasi-stationary modes.
Transient modes of the EUDC cycle are divided into sections with a duration Δt = 1s, during which the parameters of the test mode also do not change, the speed is conditionally considered constant (Fig. 6).
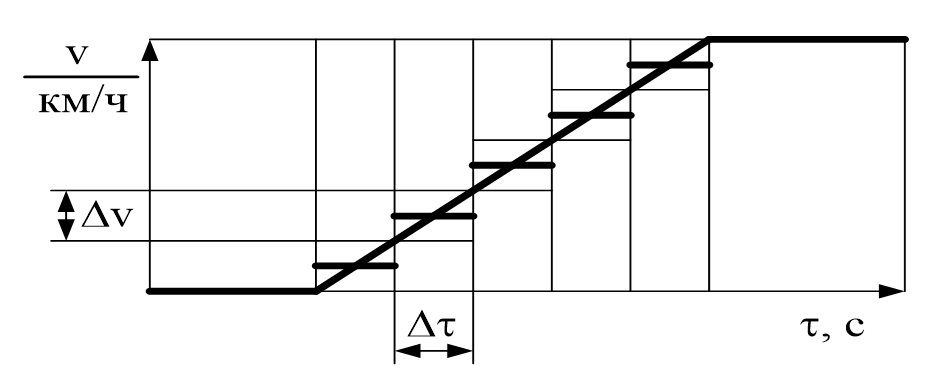
Fig. 6. Transformation of the transition process into a sequence of elementary quasi-stationary modes in the EUDC cycle.
In quasi-stationary modes, changes in the motor adjustment parameters in transient modes (for example, enrichment of the mixture with a sudden increase in load) are taken into account, and such elementary modes are conditionally considered stationary. In addition, empirical correction factors (e.g. proposed in Тurenko, Abramchuk, & Poyda, 2009) are used to calculate emissions of toxic components and fuel consumption by a vehicle in quasi-stationary mode.
To simplify the computational study, the transition modes in the ECE 15 cycle are replaced by stationary ones according to the scheme proposed (Fig. 7). Studies conducted in (Glagolev, 1950) showed that this diagram allows to ensure maximum compliance with the indicators of efficiency and toxicity of the calculated and experimental cycle (Kulchitsky, 2000) & Kanilo P.M., Bey I.S., Rovensky O.I. (2000).
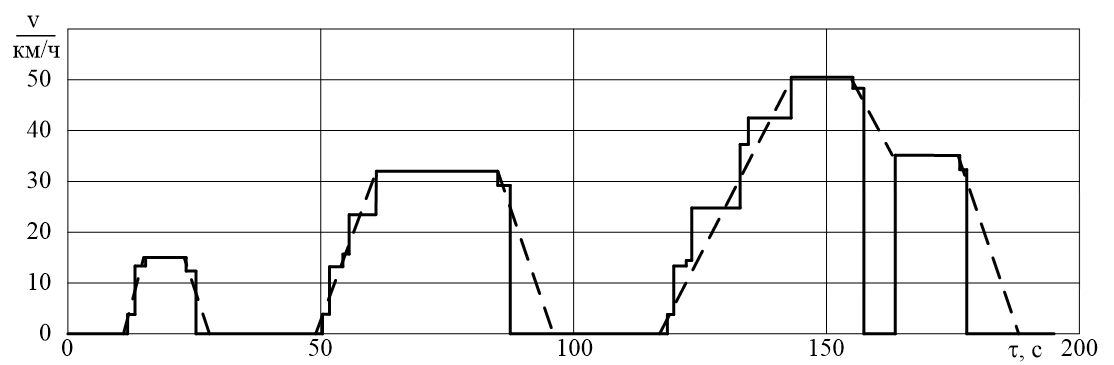
Fig. 7. The design diagram of the simplified urban driving cycle ECE 15:
– – – – – – standard driving cycle;
––––––––– – simplified driving cycle.
The required frequency of rotation of the engine crankshaft, мin-1 (Gasparyants, 1978).
 . (1)
. (1)
Frontal area of the car, м2.
![]() . (1)
. (1)
Engine power requirement, kW
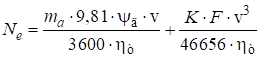 (3)
(3)
Power according to the external speed characteristic at the given revolutions, kW.
![]() . (4)
. (4)
Required specific load on the engine at a given power, %
![]() . (5)
. (5)
The required torque, N.m
![]() . (6)
. (6)
The values of nand![]() calculated according to equations (1) and (5) determine the operating mode of the engine. Based on the data of the mode, they are determined experimentally on the brake stand or calculated according to the updated method of I.I. Vibe engine out put parameters ge, gCO, gCH, and gNOx. When calculating the definition of the listed indicators of the adjustment parameters of the engine are set by a specialist or taken from the characteristic cards.
calculated according to equations (1) and (5) determine the operating mode of the engine. Based on the data of the mode, they are determined experimentally on the brake stand or calculated according to the updated method of I.I. Vibe engine out put parameters ge, gCO, gCH, and gNOx. When calculating the definition of the listed indicators of the adjustment parameters of the engine are set by a specialist or taken from the characteristic cards.
Fuel consumption by a car in elementary mode, g (Gasparyants, 1978).
![]() , (7)
, (7)
Where tmode is the duration of the elementary mode,
If the mode is transient, then this is taken into account using formulas (Gasparyants, 1978).
Calculation of fuel consumption in transition mode l
![]() , (8)
, (8)
![]() , (9)
, (9)
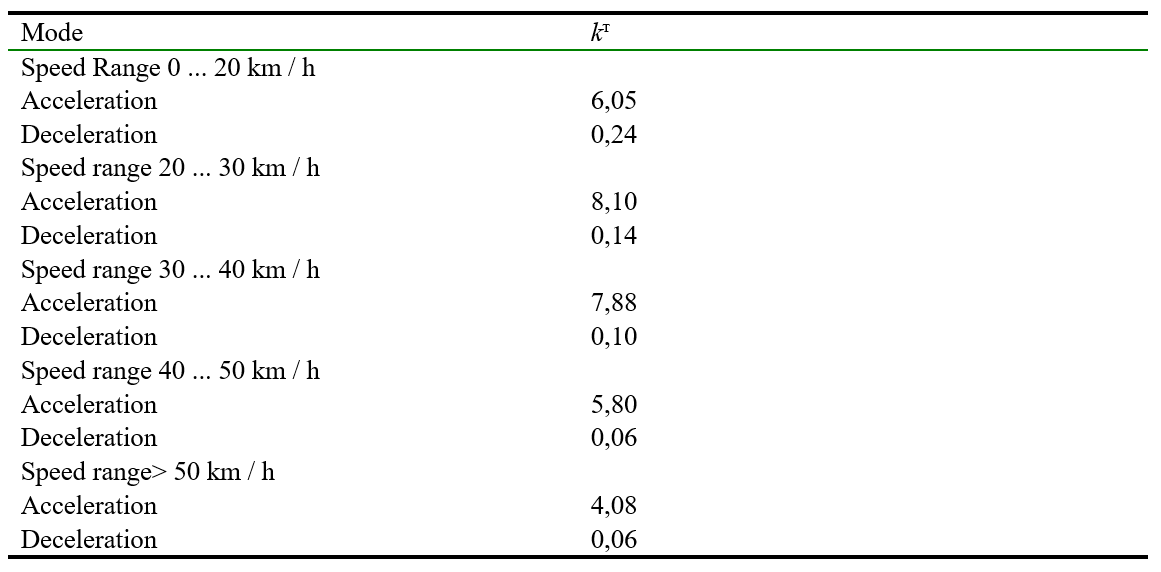
where![]() are empirical coefficients that take into account the change in fuel consumption of the car during acceleration and deceleration, respectively Lukanin V.N., & Trofimenko Yu.V., (1996).
are empirical coefficients that take into account the change in fuel consumption of the car during acceleration and deceleration, respectively Lukanin V.N., & Trofimenko Yu.V., (1996).
As an example, consider the Cummins engine type CG 250. This engine is normally installed on the bus PAZ-320412.
According to the classification adopted in (Lukanin, Buslaev, Trofimenko, & Yashina, 1998), the PAZ-320412 bus with the Cummins CG 250 engine installed on it belongs to the M3 category.
The values of the coefficients
![]() for a vehicle of this category are given in table 3.
for a vehicle of this category are given in table 3.
Table 3.
Coefficient values for vehicles of group M3
The total fuel consumption for the NEDC driving cycle is calculated by the formula, (g/km)
![]() , (10)
, (10)
where![]() is the total fuel consumption during the NEDC cycle, g;
is the total fuel consumption during the NEDC cycle, g;
![]() - total fuel consumption during the cycle ECE15, g; -
- total fuel consumption during the cycle ECE15, g; -![]() – total fuel consumption during the EUDC cycle, g
– total fuel consumption during the EUDC cycle, g
Table 4.
Shows a comparison of the calculated fuel consumption for the NEDC driving cycle with experimental data
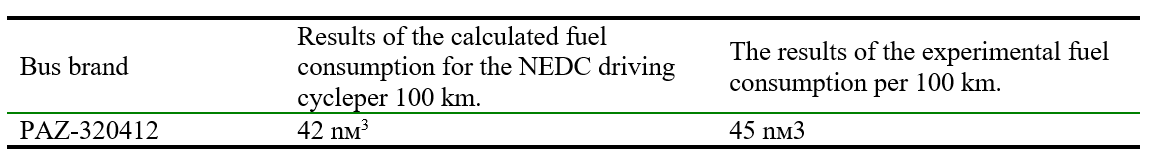
Experimental data on the fuel consumption of this bus per 100 km. showed 49 nm3, and theoretical calculations of bus fuel consumption per 100 km. by the proposed method showed 48 nm3.
Conclusions
To assess the traction and speed properties of the bus, the proposed combined method can be used which allows one to obtain calculation of fuel consumption which is closer to the experimental data on a driving cycle. Using the source data of the vehicle, effective engine performance indicators are evaluated. A calculation method is proposed for modeling a test, and experimental driving cycle of automobile transport with a total mass of more than five tons is suggested.