
DOI:https://doi.org/10.34069/AI/2021.47.11.9
Software implementation of the main cluster analysis tools
Программная реализация основных инструментов кластерного анализа
Olga V. Aleksashina42
Abstract
This article discusses an approach to creating a complex of programs for the implementation of cluster analysis methods. A number of cluster analysis tools for processing the initial data set and their software implementation are analyzed, as well as the complexity of the application of cluster data analysis. An approach to data is generalized from the point of view of factual material that supplies information for the problem under study and is the basis for discussion, analysis and decision-making. Cluster analysis is a procedure that combines objects or variables into groups based on a given rule. The work provides a grouping of multivariate data using proximity measures such as sample correlation coefficient and its module, cosine of the angle between vectors and Euclidean distance. The authors proposed a method for grouping by centers, by the nearest neighbor and by selected standards.
The results can be used by analysts in the process of creating a data analysis structure and will improve the efficiency of clustering algorithms. The practical significance of the results of the application of the developed algorithms is expressed in the software package created by means of the C ++ language in the VS environment.Keywords: сluster analysis, cluster, distance function between vectors, dendrogram, matrix, divergence measure, method of grouping a set of objects.
Аннотация
В данной статье рассматривается подход к созданию комплекса программ по реализации методов кластерного анализа. Проанализирован ряд инструментов кластерного анализа по обработке исходного набора данных и их программная реализация, а также сложности применения кластерного анализа данных. Обобщён подход к данным с точки зрения фактического материала, поставляющего информацию для изучаемой проблемы и являющийся основой для обсуждения, анализа и принятия решений. Кластерный анализ представляет собой процедуру, на основе заданного правила объединяющую объекты или переменные в группы. В работе обеспечивается проведение группировки многомерных данных с помощью таких мер близости как выборочный коэффициент корреляции и его модуль, косинус угла между векторами, евклидово расстояние. Авторами предложен метод группировки по центрам, по ближайшему соседу и по выбранным эталонам.
Результаты могут быть использованы аналитиками в процессе создания структуры анализа данных, позволят повысить эффективность алгоритмов кластеризации. Практическая значимость результатов применения разработанных алгоритмов выражается в созданном средствами языка С++ в среде VS пакета программ.
Ключевые слова: кластерный анализ, кластер, функция расстояний между векторами, дендрограмма, матрица, мера расхождения, метод группировки множества объектов.
Introduction
When analyzing and predicting a wide variety of phenomena and processes, they are often faced with the multidimensionality of their description and many characteristics. Therefore, a tool is needed that provides methods for quantitative multivariate analysis. One of these tools is a cluster analysis, which is a descriptive procedure and does not make any statistical conclusions, but provides an opportunity to study the structure of the data.
To date, many dozen different clustering algorithms have been developed, referring to hierarchical and non-hierarchical one.
Cluster analysis is a method of classification analysis. Its main purpose is to divide the set of objects and attributes under study into homogeneous in some sense groups (Gubler and Genkin, 1973), or clusters. It is a multivariate statistical method, which assumes that the initial data can be of considerable volume, i.e. the number of objects of research (observations) and the signs characterizing these objects can be significantly large (Ayvazyan et al., 1989).
In applied statistics, multivariate statistical methods could not be used for a long time due to the lack of computing technology for processing large data sets.
The most common software products that implement cluster analysis methods are STATISTICA, SPSS Statistics Base and MATLAB. However, they are expensive and, in addition, their common disadvantage is the limited set of clustering methods and parameter settings. In this paper, an attempt is made to solve this problem by implementing own algorithms using an object-oriented programming language.
Clustering technique can be used in a variety of applied fields. Although most often this type of analysis is used in economics, it can also be used in biology, psychology, medicine and many other spheres of human activity, using a standard set of tools for these purposes (Agresti, 2018).
Based on an analysis of the theoretical foundations and a review of the available literature on the problem under consideration, the paper proposes a practical approach to one of the ways to group multidimensional data.
The purpose of the article is to consider an approach to creating a set of programs to implement the basic tools of cluster analysis based on the proposed method of clustering multivariate data and to give useful recommendations for improving clustering algorithms and approaches to create a data analysis framework.Theoretical Basis
The basis for the practical application of cluster analysis is always some axiomatics of transformations and the introduction of a metric that serves to assess the objects under study and the distances between them. Typically, the distance between two objects is represented by a non-negative proximity function, which is introduced for any objects in the cluster analysis. If we consider the real control conditions, it is more efficient to compare objects by integral characteristics. Unfortunately, this method is far from always applicable due to the impossibility of agreeing all units of measurement, taking into account the difference in metric fields. Researchers are forced to introduce some generalized form of the metric, to use transfer functions with coefficients obtained mainly by heuristic methods. These methods of solving the problems of cluster analysis are usually devoted to separate studies on specific objects. The works (Durand and Odell, 1974; Jambu, 1988) very clearly demonstrate the use of a technique based on measuring the distance between objects. However, the described technique has limited applicability, and in the case of using incomparable parameters, its application without the formation of a normalized metric space is incorrect.
We can use many of the distance functions proposed in different works on cluster analysis or our own. Several more frequently mentioned distance functions should be noted: L-norm; Mahalanobis function, which generalizes the possible options for using Euclidean metric, is given in matrix form and the transformation of the correlation matrix is invariantly non-degenerate linear transformations (Durand and Odell, 1974); Jeffreys-Matusita distance function.
In the theory of classification, the most interesting are similar objects that have identically equal characteristics and some differences. In those cases when the objects coincide absolutely in all characteristics, the problem becomes trivial and is not interesting. The arbitrariness of the interpretation of similarity allows classifying very different objects into one group, but coinciding in those characteristics that are recognized as essential under these conditions. The statistical recognition theory allows such groups to be called homogeneous. Thus, in the considered problem of classifying any arbitrary objects according to predetermined characteristics, which are determined by the control objectives and known properties of objects, it is required to assess the degree of similarity and difference for an incomplete group of characteristics.
Among the many similarity measures (Van Ryzin, 1977; Kliger et al., 1978; Soshnikova et al., 1999) for use in the analysis of informal information, often in a fuzzy setting, the most acceptable are those in which the similarity criterion is taken as the minimum distance between the same measurements of objects. In difficult cases of incomparability of metrics, the absence of numerical characteristics of the distances between objects, the study of non-formalized objects and the known distance functions are inapplicable. In such problems, an abstract normalized space is used with intervals of reduced distances belonging to [0;1].
A feature of the tasks solved by clustering methods is the ability to use almost any information about the objects of research: formalized and written in an arbitrary form, objective and subjective, directly measured or obtained by indirect means, systematized and chaotic.
This information needs not only classification, but also preliminary adaptation for processing and standardization. Such heterogeneous and unstructured information about the objects under study can legitimately be considered a complex set that requires decomposition, scaling and normalization for subsequent clustering, structural and meaningful analysis.
According to J. Van Ryzin (1977), there are three types of information used in cluster analysis. He refers to the first type of multidimensional data. The second type is proximity data (metric and other distances between objects). The third type is data on clusters: coordinates in the feature space, characteristics and properties and cluster boundaries.
In applied problems of clustering, there are two types of characteristics of objects: objective indicators that can be assessed by direct measurement and those indicators that cannot be measured in their original form. The second type of parameters requires the introduction of indirect units of measurement, expert assessments and public opinion polls. Obviously, the first group of objective indicators can be directly measured with a given accuracy, while the second group is characterized not only by uncertainty, but also by the variability of indicators. The numerical characteristics of the first group, as a rule, correspond to Euclid's axioms. For subjective indicators, the problem arises of choosing an acceptable metric. There are various artificial methods for this (Van Ryzin, 1977; Soshnikova et al., 1999).
The practice of processing numerical and non-numerical information involves the use of a variety of mathematical apparatus: theory of propositional algebra, set theory, pattern recognition theory, discrete mathematics, systemic and meaningful analysis. However, the use of formalized procedures requires a special substantiation of the numerical interpretation of complex phenomena that do not have a numerical measurement, the determination of the axiomatics of the operations performed and the proof of the legitimacy of the use of each operation. One of the methods for simultaneously taking into account qualitative and quantitative characteristics is to divide the measurement scale into a small number of intervals. In this case, a quality characteristic is assigned to each measurement interval.
When solving most of the problems of cluster analysis, it is convenient to use integral indicators. These integral characteristics are used at the stage of determining boundary conditions and grouping objects. Integral assessment simplifies the idea of an object, but allows flexible control of the process of distributing the elements of a set into groups during classification by including and excluding individual components from the integral characteristics. Therefore, the classification carried out on the basis of constructing the metric space in integral characteristics does not reduce its value, provided that a number of rules are observed (Durand and Odell, 1974; Van Ryzin, 1977; Kliger et al., 1978). As a criterion for the correct classification by the methods of cluster analysis, one can use such functions that contain the meaningful logic of the main tasks, the research director's understanding of how a divided set of objects should look like. And that would be the smartest decision. But most often the problem setter does not know what the results of the classification may be, and even more cannot determine a priori what partitioning should be recognized as optimal. In this case, objective functions formulated on the basis of studying the cluster matrix or intermediate clustering results come to the rescue. As a rule, these objective functions correspond to the main meaningful regularities, but this connection must be discovered and substantiated separately.
The use of objective functions makes it possible to develop algorithms for the optimization of the cluster problem and the formal selection of the most efficient partition. In practical problems, it is difficult to formulate a single objective function for finding an optimal solution. The director wants to enforce several optimization conditions. An uncomplicated sequential filtering algorithm allows using any number of objective functions.
Literature Review
To date, a significant number of clustering algorithms have been proposed. When using a wide range of input variables, different partitioning methods, they allow them to be applied in different areas and problems. Hence, there is a significant variety of options for their practical application, for example, in economics, management tasks, sociological research, solving demographic problems, and in medicine. However, the analysis of publications devoted to this problem allows concluding that most of these algorithms are purely theoretical in nature and are not implemented in specific software tools. The given methods do not differ in the detailed elaboration of a software implementation suitable for creating.
In fairly well-known sources (Durand and Odell, 1974; Van Ryzin, 1977), devoted to the practical aspects of the application of cluster analysis methods, a large number of algorithms are considered. A well-grounded conclusion is made that the choice of an algorithm for a specific task is determined to a greater extent by the mathematical culture, the availability of software and hardware with the access of the researcher, the type and power of the information field, and also depends on many other factors.
Analysis of the clustering algorithms given in the literature allows them to be classified according to the main groups:
- implementation of clustering based on a complete enumeration of the characteristics of objects (Durand and Odell, 1974; Bellman and Dreyfus, 2015), in which dynamic programming algorithms are actively used in order to reduce the computational load;
- two-stage clustering, proposing to build a model for a pre-selected core of objects of classification (Jambu, 1988);
- algorithms of the "trout" type, which are based on enumerating fixed distances from the centers of spheres (Van Ryzin, 1977);
- active use of axiomatics and the use of the information field geometrization method and a set of special algorithms for the correct calculation of the integral indicator;
- algorithm of the "crab" type, in which a certain specified quality criterion is set, and clustering is implemented as an optimization problem based on certain formalized criteria (Bellman and Dreyfus, 2015);
- variety of methods based on known clusters with fixed characteristics, which requires the use of objective functions in order to limit the number of clustering options under study (Van Ryzin, 1977; Jambu, 1988);
- algorithms based on determining the center of the cluster by calculating the arithmetic mean distance for the objects under study;
- using the branch-and-bound method;
- using of expert assessments;
- Nearest-neighbor chain algorithm that works well for hierarchically grouped objects.
In the proposed work, the theoretical and practical application of the clustering method is considered in detail with the provision of grouping of multidimensional data using the introduced special measures of proximity: by centers, by the nearest neighbor and by selected standards.
Materials and Methods
Since clusters are groups of homogeneity, the task of cluster analysis is to divide the set of objects into m clusters, so that each object belongs to only one group of division. The objects belonging to one cluster must be homogeneous (similar), and the objects belonging to different clusters must be heterogeneous.
The objects of clustering are represented as points in n-dimensional feature space (n is the number of features that characterize objects), the similarity between objects is determined through the concept of distance between points, because intuitively it is clear that the smaller the distance between objects, the more similar they are.
In the current work proposed by the authors we consider the development of a software package, implementing classical methods of cluster analysis (Gubler and Genkin, 1973; Agresti, 2018) and allowing the implementation of various specific processing approaches. Observations and variables (objects) can be processed using different distance measures and different cluster association rules.
Cluster analysis can be characterized as a method of grouping an arbitrary set of objects X by a chosen measure of proximity ![]() objects, which are considered to be points x and y (Ayvazyan et al., 1989). The set of points to be grouped can be given in the form of matrix:
objects, which are considered to be points x and y (Ayvazyan et al., 1989). The set of points to be grouped can be given in the form of matrix:
![]()
where columns define some attributes, and rows define observations in which these attributes are fixed.
Matrix X can be considered as a set of m-dimensional vectors-columns (points) or as a set of n-dimensional vectors-rows (points).
The following relations are used as distance functions ρ(x,y) between vectors x and y.
- The sample correlation coefficient between vectors x and y:
![]() , (1)
, (1)
where x=(x1, … , xm) and y=(y1, … , ym) are the dimensional vectors m;
![]() ,
, ![]() are the mean values of vector components x and y;
are the mean values of vector components x and y;
![]() are the sampling variances of vector components x and y.
are the sampling variances of vector components x and y.
- The modulus of the sample correlation coefficient between vectors х and у:
![]() , (2)
, (2)
- The cosine of the angle between vectors x and y in m-dimensional space Rm:
![]() , (3)
, (3)
where ![]() is the scalar product of vectors x and y;
is the scalar product of vectors x and y;
![]() are the vector lengths x and y.
are the vector lengths x and y.
- The module of the cosine angle between vectors x and y in space Rm:
![]() , (4)
, (4)
- Euclidean distance between points x and y in space:
![]() , (5)
, (5)
- Informative measure of divergence for which all components of x and y vectors must be strictly greater than 0:
![]() , (6)
, (6)
where ![]() ,
, ![]() .
.
The grouping of points with the selected function ρ in the work is carried out in three ways.
- According to the centers of groups, the method in which the grouping of points of the set X into natural groups is carried out according to the degree of connection between the points and the average properties of the groups. This method is described by Parks and consists in the following: for n columns of matrix X using the function
 (xi, xj) the matrix of mutual distances is calculated:
![]()
where ![]()
![]() , i-th and j-th matrix columns X;
, i-th and j-th matrix columns X;
![]() is the column spacing between
is the column spacing between ![]() and
and ![]() .
.
In the matrix X, we select two columns i1 and j1, which have the greatest similarity ![]() between each other. If there are several such pairs, the first of them is selected. Next, two selected columns i1 and j1 are replaced in the matrix X by one, whose components are the center of gravity of the corresponding vector components
between each other. If there are several such pairs, the first of them is selected. Next, two selected columns i1 and j1 are replaced in the matrix X by one, whose components are the center of gravity of the corresponding vector components ![]() and
and ![]() . This column is assigned a number i1, and the column j1 is excluded from the matrix X. As a result, we will have n-1 columns. The numbers of columns merged at the first step and the measure of their similarity are entered in the first row of the matrix:
. This column is assigned a number i1, and the column j1 is excluded from the matrix X. As a result, we will have n-1 columns. The numbers of columns merged at the first step and the measure of their similarity are entered in the first row of the matrix:
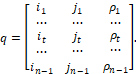
For the obtained n-1 columns the matrix Rn-1 mutual distances is calculated. Then the most similar two columns i2 and j2 are selected and are replaced by one corresponding to their center of gravity. The new column is assigned a number i2, and the column j2 is excluded from matrix X. Matrix X has n-2 columns in the second grouping step. Column numbers i2, j2 and their connection level are entered in the second row of matrix q. When combining columns which were obtained by combining other columns at the previous grouping steps, their center of gravity is determined taking into account the number of vectors they replace. After n-1 unification, we get just one column vector, whose components are the centers of gravity of the corresponding components of all the columns of matrix X. This will fill n-1 rows of the matrix q.
This method gives good results if the set of grouped points forms separate compact groups along the chosen metric ρ, and the distances between these groups are sufficiently large compared to the sizes of the groups.
If the points do not satisfy the above property, then during the grouping, when the properties of individual groups are averaged, there points with properties different from the set of properties of the grouped points may appear which may lead to an incorrect interpretation of the dendrograms of the levels of connections (Kim and Mueller, 1978). This disadvantage of grouping by group centers is eliminated in the nearest-neighbor grouping method.
2. By nearest neighbor, the way in which the groupings of points of the set X into natural groups is done by the distance between the boundaries of the groups of points. This type of grouping does not change the set of properties to be combined into groups of points. When groups are combined, measures of similarity of each element from one group with each element from another group are determined. Those groups that contain the points most similar are merged. In the case of metric (5), the similarity of the groups turns into the proximity of the boundary points. In this case, those two groups are united whose boundaries have minimal distance between them.
Under certain conditions this method of grouping allows to gather into groups the points obeying the same functional dependence, while grouping by centers of groups splits the same set of points into groups with different properties of points inside each of them.
3. According to the benchmarks, a way of dividing points of the set X into groups according to the strength of their connection with the benchmark points. This grouping is as follows. The reference set is a set in the form of a matrix:
![]()
We consider the grouping of columns. For each column xi of the matrix X is determined by the column of the reference matrix E, which is most similar to the column xi. Numbers s and i, as well as a measure of similarity ![]() are entered into the matrix q.
are entered into the matrix q.
After splitting the columns of matrix X by the etalons of matrix E, we obtain k groups. Some groups can be empty, i.e. contain only the etalon and not contain any columns from matrix X. The columns of matrix X that fall into the group formed by the reference column es, are ordered according to their resemblance to it.
X and E matrices can be merged into one, specifying which columns will be considered the reference (7).
![]() (7)
(7)
Reference column numbers in the merged matrix X![]() are a set by the array
are a set by the array ![]() integers and the numbers of the reference strings by array
integers and the numbers of the reference strings by array ![]() .
.
So, the results of each of the three types of grouping are given by the matrix q, on the basis of which the dendrogram of dependence of points and their groups is further constructed.
Results
The package provides the ability to perform calculations for both columns and rows of matrix X, regardless of the type of grouping and selected proximity measures. The work with columns or rows is set by the feature of transposition of matrix X. If the sign is equal to 0, all calculations, except Q-analysis, are performed for columns of matrix X. If the sign is equal to 1, all calculations, except the above, are performed for the rows of matrix X. If the sign is equal to 0, then Q-analysis is performed for the rows of matrix X, and if the sign is equal to one - for its columns.
It is possible to group rows or columns, not only of the whole matrix X, but also any of its submatrixes. The way to sample a submatrix of their X is given below.
Before grouping, the selected matrix (and if calculations are performed for the whole matrix, the X matrix itself) undergoes a transformation. The following transformations are implemented in the package.
- The transformation consists in the fact that each component of the vector-column is divided by the absolute value of its maximum modulo component. We obtain a system of vectors whose ends are on faces of a cube with edge length equal to 2 and centered at the origin of coordinates.
- Transformation consists in that each matrix element is divided by the absolute value of the maximum modulo element of this matrix.
- Transformation is that each component of the vector-column of the matrix is divided by the length of this vector.
For example,
![]() →
→ ![]() .
.
This normalization "equalizes" the columns with each other, making them more equal. It is used if the columns correspond to values represented in different units.
For example,
![]() →
→ ![]() .
.
This transformation preserves the ratio of distances between points and between lengths of vectors, which is especially important in some cases for Q-analysis. It can also be applied to the case of quantities having the same units. In this transformation, the ends of vectors are on the faces of a rectangular parallelepiped placed in the cube.
For example,
![]() →
→ ![]() .
.
In this transformation the angles between vectors are preserved. The vectors are made more equal than in transformation 1, i.e. they have the same length. Their ends are on a sphere with radius equal to one and centered at the origin.
This transformation can be used to group quantities that have different units. Such normalization is also convenient for functions (3) and (4).
All of the above three transformations do not affect the type of grouping using functions (1), (2), (3), and (4). However, the groupings using functions (5) and (6) can be different.
The selectable submatrix from X is given by arrays of integers d and l. The array d indicates the numbers of rows to be chosen, and the array l indicates the numbers of columns to be chosen. We consider examples of selecting rows.
The array d has the form ![]() and consists of m+2 integers, where:
and consists of m+2 integers, where:
m is the number of numbers specifying the line numbers;
n is the selection feature. If n=1 the rows specified in array d are selected from matrix X and grouping is performed for the selected rows. When n=0, the rows specified in array d are discarded from matrix X and grouping is performed for the remaining rows;
![]() are the numbers specifying line numbers.
are the numbers specifying line numbers.
The number of elements in array d does not necessarily have to be equal to the number of given strings, because strings can be given by integer intervals. We consider possible variants of setting the array d.
Let matrix X have dimensions m=200, n=60. We need to give a grouping using rows (5,6,7,8,9,10,145,171,172,173). These rows can also be specified as (5-10,145,171-173).
The options for selecting the specified lines are as follows:
- d = (10,1) (5,6,7,8,9,10,145,171,172,173);
- d = (5,1) (5, -10,145,171,-173);
- d = (8,0) (1,-4,11,-144,146,-170,174,-200).
Thus, to specify a range of rows it is sufficient to use two numbers: the first is positive, defining the beginning of the range, the second is negative, defining the end of the range. To specify all selectable rows of matrix X, we can use the following arrays:
- d = (2,1) (1,-200);
- d = (0).
The selected matrix can be printed while keeping the row and column numbers of the original matrix.
Specifying an array of reference rows and an array of reference columns is similar to specifying an array d. The difference is that the assignment of the form dэ=(0) and lэ=(0) means the rejection of benchmarks respectively rows or columns.
Example: for matrix X(200,60) the arrays are the following:
d = (2,1) (5,-100);
l = (3,0) (20,-40,55);
dэ = (3,1) (1,7,13);
lэ = (0).
This means that rows 5 through 100 are selected from matrix X and the elements belonging to columns 20 through 40 and column 55 are discarded. Next, rows 7 and 13 are selected as reference rows, and the first reference row will be discarded because it did not fit into the selected matrix. For the columns in the selected matrix, no benchmarks are given, because dэ=(0). Thus, in this example, the grouping by standards is possible only for the rows of the selected matrix.
The lack of information in the matrix X is given by the number 1хE10, with a dash. If rows of a matrix given by arrays d and l have at least one dash, such rows are excluded from it. This makes working with the matrix much easier, since there is no need to change the array d, exclude rows with dashes from it, and save the array l for different selectable groups of matrix rows X.
The analysis of the selected matrix rows is always performed before its transformation on the transposition criterion. The selected matrix may contain rows or columns with the same elements. In this case for some types of analysis such columns or rows are excluded from further consideration and a corresponding message is given if the number of columns or rows became less than two.
Rows or columns of matrix X may have names. The use of names facilitates analysis of dendrograms. Names can be assigned to individual rows or columns. The name can be numbered, indicating the number of the row (column) to which it belongs.
Input of initial information to matrix X can be done either directly or from a previously prepared file, typed by columns.
The following can be specified in the program package: the method of grouping by group centers, by nearest neighbor and by standards, type of normalization of the selected matrix, its transposition, number of dendrogram doubles and selected groupings of distance functions.
When entering the information, the quantitative restrictions, which the initial and selected matrices must satisfy, are checked. About any not met restriction the corresponding message is given.
Discussion
The approach to data analysis proposed in this work is determined by the rapid expansion of the fleet of computers, the development of their mathematical support and by the fact that the performance of many real procedures without computers is simply impossible.
The great advantage of cluster analysis is that it makes it possible to break down objects not by one feature, but by a number of features (Berkhin, 2006; Durand and Odell, 1974; Gitis, 2017). In addition, cluster analysis, unlike most mathematical and statistical methods (Kochetkov et al., 2008; Bruce and Bruce, 2018) does not impose any restrictions on the type of objects in question and allows studying a set of raw data of almost arbitrary nature.
It is necessary to add modern methods and procedures of data analysis, verification of data set by means of statistical software packages, processing of missing observations in multivariate case.
It is planned to include examples in the developed software package to demonstrate the best ways of using the proposed software, such as choosing the appropriate distance determination function, using simple programs for complex analysis and interpreting the output of the software package.
The methods of the proposed software package were used to solve the same problems as implemented in the packages Statictica (Bureeva, 2007; Borovikov, 2019), SPSS (Nasledov, 2013; Krasnikovsky, 2021) and showed comparable results. Unlike these packages, the developed software package is free of charge, and its possibilities can be expanded by including added specific methods for solving specific user tasks with a reasonable increase in the working arrays for storing the analyzed data.
Conclusion
The task of processing a set of data and combining them on a logical basis is very relevant in various fields of scientific research. As a result, the issues of data clustering are invariably highly popular. First of all, it should be clearly understood that the applicability of this or that cluster analysis algorithm is inherently based on an assumption. In spite of the fact that in the literature (Mayer-Schönberger and Cukier, 2013; Paklin, 2020) it is possible to find the description of a set of clustering algorithms and the process of their appearance does not stop, the single "ideal" algorithm, which by all parameters will be better than already existing ones, has not been proposed yet.
The use of clustering analysis algorithms can be seen as a theoretical and practical tool in the technology of big data collection and analysis (Data Mining) (Leskovec et al., 2020). However, the real benefit of using clustering is achieved only if it is used at one of the stages of forming a holistic analytical solution in the task of data analysis (Manyika et al., 2011). Naturally, it is much easier for an analyst to work with an array of similar objects, form groups of them and apply individual models for these groups. The task of developing a generalized model for all groups of data is extremely time consuming and difficult to solve (Mayer-Schönberger and Cukier, 2013).
In most cases, the data processed in Data Mining technology are characterized by large size and volume, require extra-large storages, there are many digital and descriptive attributes (Larose, 2015; Russell and Klassen, 2020). Such a feature of data imposes certain requirements, in accordance with which it is necessary to develop algorithms used in cluster analysis:
- ensuring as few database accesses as possible;
- strict requirements to the size of structures in the main memory;
- active (if possible) use of transaction techniques with the use of checkpoints to ensure the possibility of continuing the execution of calculations in case of interruptions in the current work of the algorithm;
- it is necessary to ensure the operability of algorithms when implementing access to database records in the navigation mode (unidirectional cursor);
- ensuring the scalability of the algorithm, which directly depends on its computational complexity and methods of implementation of the program code;
- from the concept of scalability follows the ability of the algorithm to tend to a linear dependence of the time costs of its implementation on the increase in the volume of processed data at fixed memory costs;
- because of the objective difficulties of simultaneous provision of scalability and effectiveness of clustering, a software package to work with Data Mining should contain algorithms, some of which are well suited for small data sets, while others are scalable and work with ultra-large databases.
The created software package was used to solve a number of problems and its application allowed obtaining satisfactory results. In addition to the practical results of the application of the developed algorithms, some of the theoretical research materials made in the work can be used by analysts in the process of creating a framework for data analysis. Based on the analysis of the obtained results of the implementation of the software package, we can conclude that there are prospects for the application of cluster analysis. Proposals and recommendations made in the work can be useful in improving the clustering algorithms.
In the future we plan to expand the range of algorithms, which will allow using the developed software to solve a greater variety of problems and obtain more adequate results.