
DOI: https://doi.org/10.34069/AI/2021.40.04.7
Dose mergers and acquisitions significantly impact the performance of banks in long run? A pre and post CAMEL study of banking in Pakistan
Abstract
The competition among corporates to become market leader is not only with in economy but also it is global and it effects the organizations in a positive or in a negative way as well in such a challenging and rapid environment Merger & Acquisition (M&A) is one of the best ways to enhance the capital, customers, and profitability. This paper is based on the CAMEL (Capital Adequacy, Asset Quality, Management Soundness, Efficiency and Liquidity Ratios) framework. Overall, twenty-five ratios before and after merger included on nine year pre and nine-year post were collected/ calculated and analyzed with SPSS and E-Views. Paired Sample T test were calculated and analyzed with the use of SPSS and structural break down test with the use of E-Views. The research after testing and analysis with software conclude that banks in long run shows significant difference in Capital adequacy ratios and Asset Quality and shows better Capital Adequacy and Asset Quality Ratios after merger among the five ratios tested.
Keywords:Acquisition, Banking, CAMEL Ratios, Long Run, Merger
Introduction
The Global business environment needs rapid changes to fulfill the demands for new goods and services to the existing and new customer base. The competition is now global and it effects the organizations in a positive or in a negative way as well in such a challenging and rapid environment Merger & Acquisition (M&A) is one of the best way to enhance the capital, customers, and profitability (Qamar abbas). Mergers occurs when two or more than two firms willingly decide to move as a joint or single entity whereas when one of the firm acquire some or whole of an organization it is termed as acquisition. (Sherman & Badillo, 2011). It is required by the organizations to understand the importance of merger and acquisition in the current era to be compete in the rapid challenging and changing environment. (Zahid & Shah, 2011)
.png)
Graph # 01. Worldwide Merger and Acquisition (Imaa, 2021)
Worldwide Merger, Acquisition bar graph is shows the world wide conditions of merger and acquisition. In lite blue color number of transactions is drawn on the vertical axis and the black line graph shows the value of transaction in Billions of USDs. Total number of deals of M & A reached nearly 50,000 worldwide during 2007 and then shows a decrease and it crossed 50,000 during 2017. So by7 the figure we can say that the no of transactions has reached 17 times during the last 35 years from 3,000 to 51,000 transactions from 1985 to 2019. So as the value has also increased (Imaa, 2021) The Merger and Acquisition is not only a closed border activity but it is also a cross border activity as its from developing to developed economies and developed to developing as well ways that is eventually updating the world’s economic boundaries (Chapman, 2003). Timely merger and acquisition is very important for the performance of the firms (Martynova & Renneboog, 2008).
Research Objectives
The basic objective is to find out the impact of merger and acquisition in the long run on the performance of banks in the Pakistan by using the CAMEL model. Further this main objective is divided in to five sub objective as follows:
- To compare pre and post-merger Capital Adequacy Ratio of merged/Acquired banks.
- To compare pre and post-merger Asset Quality Ratio of merged/Acquired banks.
- To compare pre and post-merger Management Soundness Ratio of merged/Acquired banks.
- To compare pre and post-merger Efficiency Ratio of merged/Acquired banks.
- To compare pre and post-merger Liquidity Ratio of merged/Acquired banks.
History and Overview of Banking Sector in Pakistan
There are several phases in which the banking history of Pakistan may classified No. 1 is the starting of the commercial sector banking in Pakistan that starts from the beginning of the country from the 1947. Initially the sector faces the lack of resources and uncertain political and economic situations further untrained human resource so providing inappropriate products and services. The central bank starts from July 1948 to regulate the financial sector. During the era of 1950 till 1960 central bank inspires the private banks to initiate the financial institutions but it will creates an unnatural competition due to unlawful practices, bribe, and corruption. By the reforms and the changes in the governance controlled performance of the Pakistani banking sector. (Burki & Niazi, 2003). The 2nd phase is the nationalization phase 1974 till 1978 al the banks were nationalized due to which the performance of each banks decreased the performance due to the job protection to the employees resulted in the low performance and the production of inferior services. Before it was a highly competitive sector due to the competition among the public, private & foreign banks but due to nationalization and the economic condition all of a sudden the banking sector performance recorded below par which leads to the privatization (Ahmad et al. 2010). 3rd phase is starts with the start of the Islamic banking in Pakistan with the name of Meezan Islamic bank of Pakistan in 2002 bank (State Bank of Pakistan, 2021). Before the start of the Meezan bank a few interest free services are available in Pakistan during 80s and 90s like House, Investment Corporation Pakistan (ICP), Building Finance Corporation (HBFC) and National Investment Trust (NIT). (Zaidi, 1987; Hussain, 2006; Hassan, 2007). 4th phase is the privatization of the banks Privatization is a parallel process to the Islamic conversion of the banks. Local investors are encouraged due to the deregulation and financial liberalization during the year 1992 till 2000 have developed the interest of local investors and the foreign banks to starts its operation in the country so it again creates competition the banking sector of the country. A lot of different products and services are than offered to meet the customer demand and get the share of the market and even the government banks left behind due to the slower financial development (La Porta et al. 2002). The public sector banks are not clear in their strategies and responsibilities (Clark et al. 2003). Pakistan is a low to middle income country and due to over staffing and debt burden the privatization did not get the desired objectives as it was expected. (Otchere, 2005). So the lesser improvement is recorded during the era (Khalid, 2006). 5th is the Islamic banking services focused is to satisfy customers for better profitability. SBP actively promote the Islamic banking in the country. Meezan bank a full flagged Islamic bank is started in Pakistan during 2002 and faced strict completion with the conventional banks which are already performing their banking services but they are offering interest and Meezan is an interest free banking. (Ministry of Finance, Government of Pakistan, 2020). SBP has taken several steps to stability and provide flexibility in the legislation to strengthen the diversification, financial sector growth, innovation and healthy competition.6th Phase is the current phase and it is the diversified and the improving phase in the banking sector. Healthy competition and service quality and long term customer retention strategy attracts no of different customers. During 2018, bank accounts were 50.565 million with 15,053 bank branches and for the population of 208.77 million. There are no 34 scheduled banks and 17 Islamic banks during 2020 in Pakistan.
Literature review
Analysis of Performance of Banks Using Camel ratios were conducted by the Susmitha, M., Mouneswari, V (2017) and find out the overall financial performance is satisfactory by using CAMEL ratios. Whereas Dr.Tanwar Nidhi (2017) conducted the research on the impact of merger and acquisition on Indian banking industry and concluded that the merger between strong and weak banks create disturbed on the surviving firm so the Government should not promote merger among weak and strong banks because it has a negative impact on the asset quality ratios. Dr. K.P, Veena, Prof., Patti, S.N., (2016), examine the pre and post CAMEL ratios and suggested that the post-merger monetary performance is improve after the merger, Whereas the liquidity and the profitability remains similar to the pre-merger period. CAMEL analysis if the public sector banks were also conducted by the Kaur, Jagjeet, Dr. Kaur, Vineet, Harsh, (2016) and he found only one case below the benchmark whereas all the other banks tested were found satisfactory.
Hui Boon Tan Chee Wooi Hooy, (2004) Found that the merger among the banks may bring stability amoung the financial sector of the Malysian banking industry after the collapse of stock market in the results of Asian financial crises. Bala Shanmugam Mahendran Nair, (2004) another author suggest that there is a need to change the overall financial system as a result of Information technology, Globalization, liberalization and competition. Ayse Mumcu, E. Ünal Zenginobuz, (2015) and Sonaje (2017) noticed a few important points on the basis of study on Turkish banking sector as study found that amalgamation among banks will reduced competition among the banking sector as banks are supporting the amalgamation process in the sector but no one wants to be a part of these mergers unless an intense increase in the market share or enhancement in the cost structure.
Study conducted by Kouser and Saba during (2011) with the help of certain ratios and tries to develop correlation between merger and profitability in the banking sector of Pakistan and find the negative relation. In developing economies merger in the banking sectors are not profit driven but it results in cost cutting where as ordinary in case of performance and efficiency. (Rehman et al, 2010). Further in a study on the merger and acquisition of banking in Pakistan concluded that M&A have undesirable association with banks performance and proposed to develop feasibility before going to merger and acquisition.
Shakoor, M.I. et al. (2014) M&A become international practices that are used to improve the business performance not only in the developing economies but also in the developed economies as well including USA and UK. About 2532 million pounds in 1972 and about 32600 million pounds during 1995 this abrupt increase reflects the pace of merger and acquisition (Charnes, 1978).
Awan & Azhar (2014) finds a reason that the strong firms buys weak firm at a nominal cost further he explains that loan defaults, organizational conflict, bankruptcy and the political interference are the other major causes.
Afza & Yusuf (2012) explain the fact that in the result of amalgamation of two firms we always have a new and large firm and the new firm is bigger than both of the old firm’s merger Byard et.al (2007), pointed that the management of the merged firms are the issue that should be address well and the new entity will start functioning successfully and improve within hundred days. Dymski Gary (2002) and David J. Urban Michael D. Pratt, (2000) explored that the results of merger and acquisitions are vary in various countries, various cultures and various industries. He also finds that the develop countries have less efficient results of merger and acquisition as compared to the developed countries. He further emphasis that the results of the merger and acquisition are much better in the banking sector but for cost cuttings whereas the results of the performance and efficiency are not significant. He also finds that bank size also has no significant difference before and after the merger.
Resti (1998) find company’s efficiency increases due to large size. Whereas in another study conducted on NSE listed Cos. He found a positive impact of amalgamation on the earning of the firms. Ochieng (2006) find the alarming impact of amalgamation in Kenya study conducted on the non-listed banks. Khan, (2011) conducted a study on M&A in Europe by using different ratios and find slight development in banks earning and overall performance not only in national as well as international. One of the important considerations is cultural differences especially in the cross border mergers, innovative capabilities are one of the reason for the cross border Merger (Bauer, Matzler, & Wolf, 2014)
A study conducted by the same authors (Zafar & Shah, 2021) based on the comparison of ratios of merged banks with the whole banking industry by using the data published by the state bank of Pakistan. Study based on the twenty-five ratios related to liquidity, profitability, Efficiency, capital adequacy and management soundness study reveals different results on different cases this was also a long run study.
Hypothesis of Research
H1: Post M&A, Capital Adequacy ratios of banks are significantly different from the pre M&A Capital Adequacy ratios of banks in long run.
H2: Post M&A, Asset Quality ratios of banks are significantly different from the pre M&A Asset Quality ratios of banks in long run.
H3: Post M&A, Management Soundness ratios of banks are significantly different from the pre M&A Management Soundness ratios of banks in long run.
H4: Post M&A, Efficiency ratios of banks are significantly different from the pre M&A Efficiency ratios of banks in long run.
H5: Post M&A, Liquidity ratios of banks are significantly different from the pre M&A Liquidity ratios of banks in long run.
Methodology
The research is based on the qualitative nature secondary data was collected from the state bank of Pakistan website. Ratios are extracted from the annual reports and ratios were calculated were required. As the research is based on the long run performance of Banks hence nine years (2002-2010) before and nine years (2011-2019) after the merger and acquisition data were gathered and analyzed. The study includes all the banks merged during the year 2010 as there are 3 cases of merger and acquisition. The collected data was processed into SPSS for the Paired sample tests and in E-views for the structural breakdown tests. The selected cases are as follows:
- Bank Al Barakah Ltd and Emirates Global Islamic Bank
- Bank Islami Pakistan Ltd and CITI Bank operations in Pakistan
- Faysal Bank Ltd and Royal Bank of Scotland
Research Model
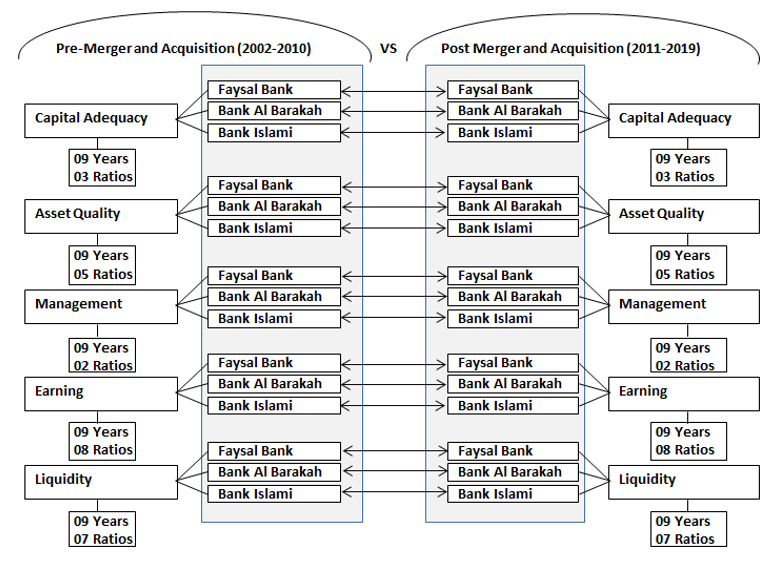
Figure # 01. Research Model.
CAMEL Ratios were collected based on the nine years pre and nine-year post M/A years of the selected banks.
- Capital Adequacy Ratios are based on the average of three different ratios.
- Asset Quality Ratios are based on the average of five different ratios.
- Management Soundness Ratios are based on the average of two different ratios.
- Efficiency Ratios are based on the average of eight different ratios.
- Liquidity Ratios are based on the average of seven different ratios.
Definition, List and calculation method of these ratios are attached in the appendix section.
Statistical Testing
Statistical testing of each bank is done separately as it is results are shown and discuss below one by one.
Bank Albarakah ltd
before - Merger Estimation Equation 1:

Where:
- PKBt is the Performance of bank.
 is the equation Constant.
- CKBt represents the Capital Adequacy Ratios.
- AKBt represents the Asset Quality Ratios.
- MKBt represents the Management Soundness Ratios.
- EKBt represents the Efficiency Ratios.
- LKBt represents the Liquidity Ratios.
 are the slope Coefficients.
- µKBt is the error term.
Collected data is processed through E-views and the results derived from the equation # 1 is provided below:
after - Merger Estimation Equation 2
Where:
- PKAt is the Performance of bank.
- is the equation Constant.
- CKAt represents the Capital Adequacy Ratios.
- AKAt represents the Asset Quality Ratios.
- MKAt represents the Management Soundness Ratios.
- EKAt represents the Efficiency Ratios.
- LKAt represents the Liquidity Ratios.
- are the slope Coefficients.
- µKAt is the error term.
Collected data is processed through E-views and the results derived from the equation # 2 is provided below:
In order to determine the significant difference between post M&A, CAMEL ratios of bank Albaraka and pre M&A CAMEL ratios of banks Albarakah in long run two different techniques were applied.
Table 1.
Structural Break down test (E-Views)
.png)
Structural breaks are the abrupt change in a time series and this could be in the mean values of other parameters. Structural break tests were applied to determine the significant change in the pre and post time series data of the banks with the dummy variables.
According to above table T01: Structural Break down test (E-Views) By the output table structural break down test researcher find that the time series of Capital Adequacy, Asset Quality and liquidity shows the structural breaks after the year 2010 as their level of significant is less than 0.05. Whereas the management soundness and liquidity does not show any significant change as their significant values are less than the level of significance that is 0.05.
Table 2.
Paired Sample T test of Bank AlBarakah (SPSS)
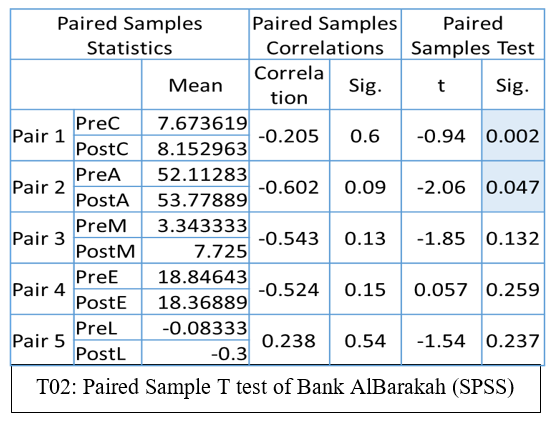
According to table T02: Paired Sample T test of Bank AlBarakah (SPSS) By the output table we can found the significant difference between Pair 1 and Pair 2 as their P values are less than 0.05, that is the level of significance these two ratios are Capital Adequacy ratios and the Asset Quality ratios. Whereas the other pairs show the insignificant difference as their P values are greater than the level of significance. These pairs are pre and post Management Soundness, Efficiency and Liquidity ratios.
Banks Islami ltd
before Merger Estimation Equation 3:
Where:
- PIBt is the Performance of Bank.
- is the equation Constant of Bank.
- CIBt represents the Capital Adequacy Ratios.
- AIBt represents the Asset Quality Ratios.
- MIBt represents the Management Soundness Ratios.
- EIBt represents the Efficiency Ratios.
- LIBt represents the Liquidity Ratios.
- are the slope Coefficients.
- µIBt is the error term.
Collected data is processed through E-views and the results derived from the equation # 3 is provided below:
after Merger Estimation Equation 4:
Where:
- PIAt is the Performance of Bank.
- is the equation Constant of Bank.
- CIAt represents the Capital Adequacy Ratios.
- AIAt represents the Asset Quality Ratios.
- MIAt represents the Management Soundness Ratios.
- EIAt represents the Efficiency Ratios.
- LIAt represents the Liquidity Ratios.
- are the slope Coefficients.
- µIAt is the error term.
Collected data is processed through E-views and the results derived from the equation # 4 is provided below:
In order to determine the significant difference between post M&A, CAMEL ratios of bank Islami and pre M&A CAMEL ratios of banks Islami in long run two different techniques were applied.
Table 3.
Structural Break down test (E-Views)
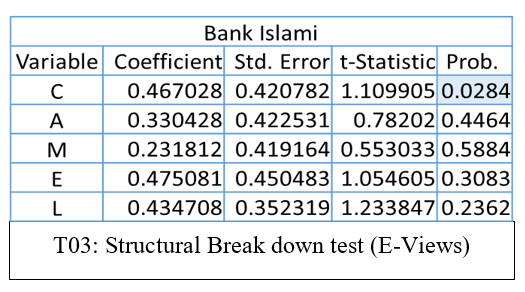
According to T03: Structural Break down test (E-Views) By the output table structural break down test researcher find that the time series of Capital Adequacy of Bank Islami shows the structural break after the year 2010 as their level of
significant is less than 0.05. Whereas the Asset Quality Management soundness and Liquidity does not show any significant change as their significant values are less than the level of significance that is 0.05.
Table 4.
Paired Sample T test of Bank Islami (SPSS)
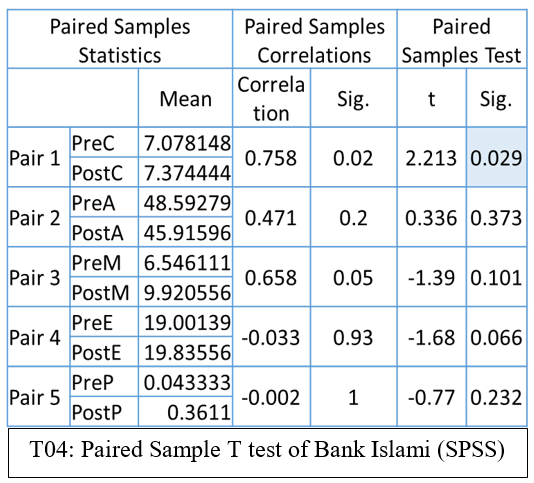
According to table T04: Paired Sample T test of Bank Islami (SPSS) By the output table we can found the significant difference between Pair 1 only as the P values is less than 0.05, that is the level of significance of Capital Adequacy ratios. Whereas the other pairs show the insignificant difference as their P values are greater than the level of significance. These pairs are pre and post Asset Quality, Management Soundness, Efficiency and Liquidity ratios.
Faysal Bank Ltd.
Before Merger Estimation Equation 5 :
Where:
- PFBt is the Performance.
- is the equation Constant.
- CFBt represents the Capital Adequacy Ratios.
- AFBt represents the Asset Quality Ratios.
- MFBt represents the Management Soundness Ratios.
- EFBt represents the Efficiency Ratios.
- LFBt represents the Liquidity Ratios.
- are the slope Coefficients.
- µFBt is the error term.
Collected data is processed through E-views and the results derived from the equation # 5 is provided below:
after Merger Estimation Equation 6:
Where
- PFAt is the Performance.
- is the equation Constant.
- CFAt represents the Capital Adequacy Ratios.
- AFAt represents the Asset Quality Ratios.
- MFAt represents the Management Soundness Ratios.
- EFAt represents the Efficiency Ratios.
- LFAt represents the Liquidity Ratios.
- are the slope Coefficients.
- µFAt is the error term.
Collected data is processed through E-views and the results derived from the equation # 4 is provided below:
In order to determine the significant difference between post M&A, CAMEL ratios of Faysal bank and pre M&A CAMEL ratios of Faysal bank in long run two different techniques were applied.
Table 5.
Structural Break down test (E-Views)
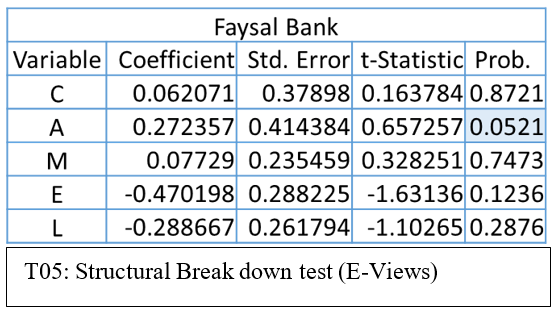
According to the table T05: Structural Break down test (E-Views) By the output table structural break down test researcher find that the time series of Capital Adequacy and Asset Quality of Bank Faysal Bank shows the structural break after the year 2010 as their level of significant is less than 0.05. Whereas the Management soundness, Efficiency and Liquidity does not show any significant change because their significant values are less than the level of significance that is 0.05.
Table 6.
Paired Sample T test of Faysal Bank (SPSS)
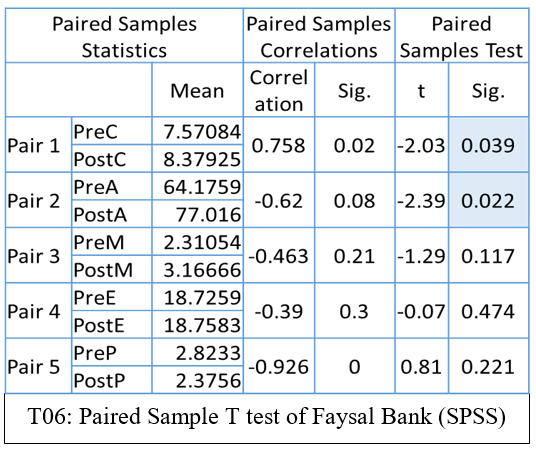
According to table T06: Paired Sample T test of Bank Faysal bank (SPSS) By the output table we can found the significant difference between Pair 1 and Pair 2 only as the P values are less than 0.05, that is the level of significance of Capital Adequacy ratios and Asset Quality. Whereas the other pairs show the insignificant difference as their P values are greater than the level of significance. These pairs are pre and post Management Soundness, Efficiency and Liquidity ratios.
Results and discusión
The study is based on the five different hypotheses related to the performance of the banks whether Merger & Acquisition lead to a better outlook of commercial banks in Pakistan. The goals of the research study were to regulate the influence of amalgamation on the financial performance of scheduled banks in Pakistan. From the financial data debated in above, the study established that the merger / acquisition, improves the overall financial performance of the banks as the T value shows all the cases under the study and all the ratios Improved in the result of merger and Acquisition. However, a few of the developments were not significant as they were prejudiced by a slow growth. As the Capital Adequacy Ratio and the Asset Quality were improved in most of the cases studied. Whereas the other three (Management Soundness, Efficiency, Liquidity) performance indicators show improvement as all of the cases included in the study shows the improvement after merger as their T values are improved after the merger.
From table T02: Paired Sample T test of Bank AlBarakah (SPSS) T values of pre and post-merger or acquisition of Bank Albarakah derived from the paired sample T Test based on CAMEL Ratios are as Capital Adequacy Ratio before merger 7.673619, after merger 8.152963, Asset Quality Ration before merger 52.11283, after merger 53.77889, Management Soundness Ratio before merger 3.343333, after merger 7.725, Efficiency Ratio before merger 18.84643, after merger18.36889, Liquidity Ratio before merger -0.08333, after merger -0.3 by looking at these values it can easily be sad that almost all the t values after merger are improved or remain similar.
From table T04: Paired Sample T test of Bank Islami (SPSS) T values of pre and post-merger or acquisition of Bank Islami derived from the paired sample T Test based on CAMEL Ratios are as Capital Adequacy Ratio before merger 7.078148, after merger 7.37444, Asset Quality Ration before merger 48.59, after merger 45.91, Management Soundness Ratio before merger 6.546111, after merger 9.920556, Efficiency Ratio before merger 19.00139, after merger 19.83556, Liquidity Ratio before merger 0.043333, after merger 0.3611 by looking at these values it can easily be sad that almost all the t values after merger are improved only the value of the asset Quality shows a little decline but that decline is also insignificant.
From table T02: Paired Sample T test of Faysal Bank (SPSS) T values of pre and post-merger or acquisition of Faysal Bank derived from the paired sample T Test based on CAMEL Ratios are as Capital Adequacy Ratio before merger 7.57084, after merger 8.37925, Asset Quality Ration before merger 64.1759, after merger 77.016, Management Soundness Ratio before merger 2.31054, after merger 3.16666, Efficiency Ratio before merger 18.7259, after merger 18.7583, Liquidity Ratio before merger 2.8233, after merger 2.3756 by looking at these values it can easily be sad that almost all the t values after merger are improved only the value of the Liquidity shows slight decline but that decline is also insignificant.
Conclusion
On the basis of the findings of the study researcher that commercial banks financial performance improves with the M & A due to higher Capital Adequacy and Asset Quality Ratios Which Improves Bank’s financial performance in the long run. With increased Capital Adequacy ratio any bank can facilitate its depositors and also it is advised by the state bank of Pakistan to maintain certain level of Capital Adequacy Ratios. Which are resulting a higher profit with less amount of risks. The study also concludes that M & A has a significant impact on the Asset Quality and it determines that the organization has improved quality and worth of assets after merger and acquisition. Whereas the other hypotheses are not showing significant results but the higher values of T values show that they are also somewhat improved but not significantly improved after the merger and acquisition.