
Gender aspects of entrepreneurs’ motivation in modern countries
Гендерные аспекты мотивации предпринимателей в современных странах
Abstract
Entrepreneurship plays an important role in both developed and developing countries. Therefore, an urgent problem is to study the motivation of starting entrepreneurs. The aim of the study is to measure indicators offering the levels of motivation (forced and voluntary) of men and women who want to create their own businesses in modern national economies. Our research is based on empirical data obtained from the 2019 Global Entrepreneurship Monitoring Project for 59 countries. The study proved that the share of the quantity of men voluntarily involved in the creation of new businesses in most countries is greater than the share of women in the total quantity of relevant gender strata. The average values of six indicators describing the motivation of women and men for the countries under consideration were determined; presented the difference of indicators by country; identified countries with maximum and minimum indicators.
Keywords:entrepreneurs, forced entrepreneurship, voluntary entrepreneurship, women, men, gender gap
Аннотация
Предпринимательство играет важную роль, как в развитых, так и в развивающихся странах. Поэтому актуальной проблемой является изучение мотивации ранних предпринимателей. Целью исследования является оценка показателей, описывающих уровни мотивации (вынужденной и добровольной) мужчин и женщин, желающих создать собственные бизнесы в современных национальных экономиках. Наше исследование основывается на эмпирических данных, полученных по итогам проекта Глобального мониторинга предпринимательства за 2019 год по 59 странам. В исследовании было доказано, что удельный вес количества мужчин, добровольно вовлеченных в создание новых бизнесов по большинству стран больше удельного веса женщин, в общей численности соответствующих гендерных страт. Были определены средние значения шести показателей, описывающих мотивацию женщин и мужчин по рассматриваемым странам; продемонстрировано наличие существенной дифференциации показателей по странам; определены страны с высокими и низкими уровнями рассматриваемых показателей.
Ключевые слова:предприниматели, вынужденное предпринимательство, добровольное предпринимательство, женщины, мужчины, гендерный разрыв.
Introduction
In recent years, entrepreneurship in most countries has provided significant economic growth (Cowling et al., 2018; Kiseleva et al., 2019; Pinkovetskaia et al., 2019; Pinkovetskaia et al., 2020a; Pinkovetskaia et al., 2020b), an increase in gross domestic product, the creation of new jobs (Dobbs & Hamilton, 2007), and the reduction of poverty (Gorchels, 2012). At the same time, as the accumulated experience shows, people start their own business for two main, although not necessarily mutually exclusive reasons. The first reason is due to the fact that a part of the population has no other opportunities to ensure their employment and, accordingly, earn money. The second reason is due to the desire of people to improve their financial situation and social status by searching for opportunities to start an entrepreneurial activity. Accordingly, we can say that people involved in entrepreneurship start creating businesses out of necessity or whenever possible.
Scientific studies, for example (Welter et al., 2006; Menzies et al., 2004; Ahl & Nelson, 2010), have shown differences between men and women who create new businesses. At the same time, the number of women starting business activities in recent decades has increased significantly (Bjerke, 2007; Holienka et al., 2016). Therefore, one of the most urgent problems in this case is the study of the existing gender differences in the motives of early entrepreneurship (Brush et al., 2009; Sullivan & Meek, 2012; Kostetska & Berezyak, 2014). Early entrepreneurs are representatives of the adult population (from 18 to 64 years old) who have either started their own new business or have already owned it for less than 3.5 years.
Thus, it is interesting to analyze the gender aspects of the motivation of people involved in the creation of their own businesses. That is, the study of the features of early entrepreneurship, characteristic of women and men. It should be noted that the study of gender differences in the motives of these categories of people has not yet been given sufficient attention in publications.
The aim of the paper is to measure indicators showing the levels of forced and voluntary motivation of men and women who are early entrepreneurs. At the first stage, empirical data sets describing the participation of women and men in various countries in the creation of their own businesses were formed. At the second stage, the specific weights of the participation of men and women in early entrepreneurship were determined. At the third stage, medium values of indicators characterizing the motives of women entrepreneurs and men entrepreneurs were determined. In addition, countries with maximum and minimum levels of indicators were identified. At the same time, both the territorial location of such countries and the average income of the population in them were taken into account.
Materials and Methods
As already mentioned, the main options for motivation when adults create their own businesses are the need or availability of opportunities. The first option is called forced entrepreneurship, and the second – voluntary. Our study examined the evaluation of six indicators that characterize the gender aspects of early entrepreneurship motivation in 59 countries:
- the proportion of women who are forced to create their own business in the total quantity of starting female entrepreneurs (indicator 1);
- the proportion of men who were forced to create their own business in the total quantity of starting male entrepreneurs (indicator 2);
- the ratio of the values of indicators for women and men who are forced to create their own business (indicator 3);
- the proportion of women who voluntarily create their own businesses in the total quantity of starting female entrepreneurs (indicator 4);
- the proportion of men who voluntarily create their own businesses in the total quantity of starting male entrepreneurs (indicator 5);
- the ratio of the values of indicators for women and men who voluntarily create their own business (indicator 6).
As the initial information in our study, information was taken from project (Global Entrepreneurship Monitor, 2019).
In the course of the study there was a test a test of the following three hypotheses:
- hypothesis 1 - the values of the six indexes have a significant differentiation between different countries;
- hypothesis 2 - the geographical location of countries does not significantly affect the values of each of the six indicators;
- hypothesis 3 - the level of income of the population in the countries under consideration does not significantly affect the values of each of the six indicators.
The estimation of the values of the six indexes was based on the economic and mathematical modeling of the initial empirical data. The density functions of the normal distribution were used as models, the methodology for developing them for estimating the values of indicators is given in the article (Pinkovetskaia & Slepova, 2018). The discussing models allow us to determine the medium values of each of the six indicators for the countries, and the ranges of their variation that are similar for countries. In addition, the study identified countries in which the considered indicators have values higher than the upper and lower than the minimum limits of the ranges. The intervals of the indicator ranges for 68% of the countries were determined based on the medium values of the indexes and the discussing standard deviations. The minimum bound of the interval is equal to the difference between the mean and the standard deviation, and the upper bound is equal to their sum.
Results and discussion
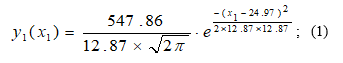
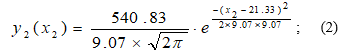
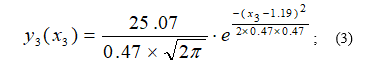
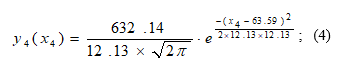
In the course of the computational experiment, economic and mathematical modeling was carried out on the basis of empirical data. The models that describe the distribution of the six indicators across all 59 countries are shown below:
- the proportion of women who are forced to create their own business in the total quantity of starting female entrepreneurs, %
- the proportion of men who were forced to create their own business in the total quantity of starting male entrepreneurs,%
- the ratio of the values of indicators for women and men who are forced to create their own business
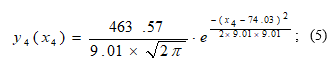
- the proportion of women who voluntarily create their own business in the total quantity of starting female entrepreneurs,%
- the proportion of men who voluntarily create their own business in the total quantity of starting male entrepreneurs,%
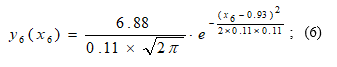
- the ratio of the values of indicators for women and men who voluntarily create their own business
The quality of the developed models was evaluated using three tests: Kolmogorov-Smirnov, Pearson, Shapiro-Wilk. The computational experiment showed that six models are of great quality.
The density functions of the normal distribution (1)-(6) make it possible to identify a quantity of significant patterns that characterize the existing informal financing of new SMEs in the countries under consideration. The average values of the indicators are shown in column 2 of Table 1. Column 3 of the same table shows the intervals of change in the values of the indicators for most countries.
Table 1.
Indicators that characterize the motivation of starting entrepreneurs.
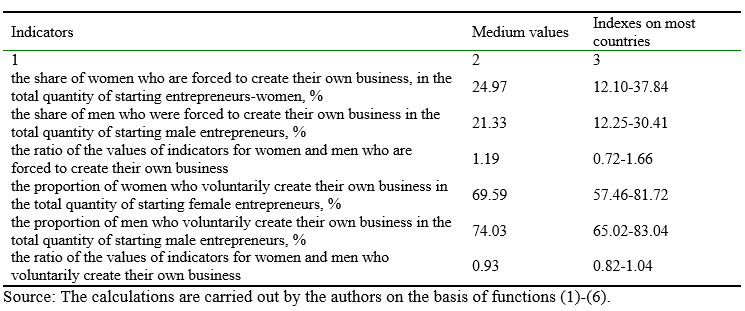
The data in Table 1 (column 2) shows that the main motive for creating their new businesses is the desire of people to take advantage of the opportunities that have appeared. In most of the countries considered, the adult population involved in entrepreneurship, in the survey process, referred to themselves as voluntary entrepreneurs. At the same time, the average proportion of men who voluntarily created their own businesses in the total quantity of starting entrepreneurs was more than 74%. The level of such motivation among women was slightly lower but reached almost 70%. The trend of exceeding this indicator for women was typical for most countries. However, in 16 countries, namely Sweden, Luxembourg, Israel, Poland, Canada, Turkey, Kazakhstan, Cyprus, Iran, Latvia, Morocco, Austria, China, Korea, Panama and the United States, the proportion of forced male entrepreneurs was higher than that of female entrepreneurs. Accordingly, on average, for the entire sample, the ratio of the values of these indicators for women and for men was 1.19.
On average, in the countries we studied, the indicators of forced motivation of people who create their own business were significantly lower, compared to the indicators of voluntary motivation. About three times less adults were forced to show starting entrepreneurial activity, compared to those who were involved in this process voluntarily. This pattern was observed for both gender groups. So, according to the share of men who were forced to create their own business, in the total quantity of starting male entrepreneurs was about 25%. The level of forced motivation among women entrepreneurs was a little more than 21%. The trend of exceeding these indicators for women was typical for most countries. Only in seven countries, namely Canada, China, Iran, Latvia, Morocco, Poland and Qatar, the proportion of voluntary women entrepreneurs was higher than that of male entrepreneurs. Accordingly, on average, for the entire sample, the ratio of the values of these indicators for women and for men was 0.93.
To test hypothesis 1, the information in table 1 (column 3) were analyzed. The analysis showed differentiation in the values of each of the six indexes for the countries under consideration. Therefore, hypothesis 1 was confirmed.
The next step was to identify the countries where the maximum and minimum values of each indicator were noted. In this case, the maximum values are those that exceed the upper limits of the ranges specified in column 3 of Table 1, and the minimum values are those that are less than the lower limits of the specified ranges. The results of this analysis are shown in table 2. Along with the lists of countries, this table also provides a division of the identified countries by their geographical location and income level.
Table 2.
Countries with high and low indicator values.
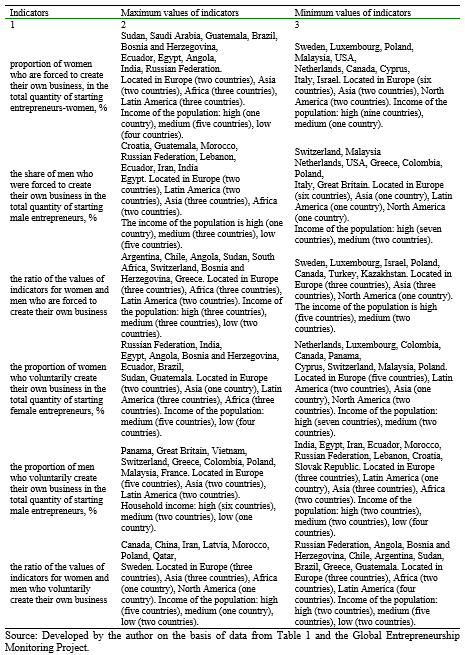
Table 2 provides information on the geographical location of countries with high (column 2) and low (column 3) values for each of the six indicators evaluated in our study. The analysis of this information showed that there are no links between these values and the territorial location of the countries, as well as the level of income of the population in these countries. That is, both high and low values of indicators are observed in countries located in different parts of the world, as well as with different levels of income of the population. This allowed us to conclude that hypotheses 2 and 3 were confirmed.
It is of interest to study the data describing the values of the considered indicators in Russia:
- the value of indicator 1 is 51.2%, which is 2 times more than the average value for all countries;
- the value of indicator 2 is 32.9%, which is 1.5 times higher than the average value for all countries;
- the value of indicator 3 is 1.6, which is 1.3 times higher than the average value for all countries;
- the value of indicator 4 is 39.0%, which is almost 1.8 times lower compared to all countries;
- the value of indicator 5 is 62.9%, which is 18% less than the average value for all countries;
- the value of indicator 6 is 0.6, which is 1.5 times lower than the average value for all countries.
Conclusion
The goal set during the study, namely, the evaluation of indicators describing the motivation of men and women when creating their own businesses according to the main options, was achieved. The conclusions of the study, which contain scientific novelty and originality, include:
- The evaluation of indicators characterizing the specific weights of differently motivated men and women who were forced and voluntarily involved in starting entrepreneurship was carried out.
- The distribution of six indicators describing the motivation of women entrepreneurs and men entrepreneurs is modeled.
- It is proved that the share of the quantity of men voluntarily involved in the creation of new businesses in most countries is greater than the share of women in the total quantity of relevant gender strata.
- It is proved that the share of the quantity of men who are forced to be involved in the creation of new businesses in most countries is less than the share of women in the total quantity of relevant gender strata.
- The medium values of each of the six indexes under consideration are established, as well as the intervals of their change that are typical for most countries.
- It is shown that there are significant differences in the values of the six indicators considered by country.
- Countries with high and low values for each of the six indicators are presented.
- The comparison of the values of the indicators for Russia and all other countries was carried out.
The results obtained are of theory and empirical approach for governments and entrepreneurs. The methodology approach to assessing the motivation of starting entrepreneurs presented in the article can be used in further research. The new knowledge gained is of interest and can be used in the educational process at universities.
The study had restriction on empirical information on the fact that only 59 countries were considered.