
Cognitive regulation strategies as mediation in anxiety and academic adjustment in university students
Estrategias de regulación cognitiva como mediación en ansiedad y ajuste académico en estudiantes universitarios

Abstract
The aim was to investigate the relationship between and among cognitive emotion regulation, test anxiety and academic adjustment and the possibility of cognitive emotion regulation (CER) to mediate the relationship between academic adjustment (TA) and academic adjustment (AA). We hypothesized that the association between test anxiety and AA is mediated by cognitive emotion regulation. Convenient sampling method was employed to recruit the participants. The sample of the study consisted of 180 students (100% males) representing students from college of education, Jazan University, KSA, aged 19-21 years, with an average of 20.2 years, with a standard deviation of 5.45. For the purpose of this study, quantitative survey research was employed, with cognitive emotion regulation as independent variable, and TA and TA as dependent variables. Findings revealed that adaptive cognitive emotion regulation correlates negatively with TA, and also negatively with AA. On the other hand, Maladaptive cognitive emotion regulation was found to be positively correlated with AA. While AA found to be negatively correlated with TA. The coefficients related to the Adaptive CER regression paths to TA and AA, Maladaptive cognitive emotion regulation regression paths to TA and AA are significant at 0.01 level regardless of their direction.
keyword
Adaptive/Maladaptive CERS, TA, TA, College Students.
Resumen
El objetivo era investigar la relación entre la regulación de la emoción cognitiva, la ansiedad ante los exámenes y el ajuste académico y la posibilidad de la regulación de la emoción cognitiva (CER) para mediar la relación entre el ajuste académico (TA) y el ajuste académico (AA). Presumimos que la asociación entre la ansiedad de prueba y AA está mediada por la regulación cognitiva de las emociones. Se empleó un método de muestreo conveniente para reclutar a los participantes. La muestra del estudio consistió en 180 estudiantes (100% hombres) que representaban a estudiantes de la facultad de educación de la Universidad de Jazan, KSA, con edades entre 19 y 21 años, con un promedio de 20.2 años, con una desviación estándar de 5.45. Para el propósito de este estudio, se empleó una investigación de encuesta cuantitativa, con regulación cognitiva de las emociones como variable independiente, y TA y TA como variables dependientes. Los hallazgos revelaron que la regulación adaptativa de la emoción cognitiva se correlaciona negativamente con TA y también negativamente con AA. Por otro lado, se encontró que la regulación cognitiva desadaptativa de las emociones se correlaciona positivamente con AA. Mientras que AA encontró una correlación negativa con TA. Los coeficientes relacionados con las rutas de regresión adaptativa CER a TA y AA, las rutas de regresión de regulación cognitiva desadaptativa cognitiva a TA y AA son significativas a un nivel de 0.01 independientemente de su dirección.
Palabras clave
Adaptive / Maladaptive CERS, TA, TA, estudiantes universitarios.
Introduction
In emotion regulation, environmental demands affect the way people present their emotions (Omaima,2018). Additionally, emotion regulation includes mechanisms that can regulate individual's social environment even if this same individual feels these emotions (Kamalinasab&Mohammadkhani,2018). CER, which are affected by certain events, that is, the events that elicit emotions that are used to regulate emotional experiences, are among the most common ERS (Bargh & Williams, 2007).
There are 2 types of Cognitive Emotion Regulation (CERS). They are adaptive CERS and maladaptive CERS (Omaima,2018).Adaptive CERS consist of acceptance(the person thinks of accepting whatever negative event and resign himself/herself to this event); positive refocusing (the person thinks of positive events); refocus on planning (the person thinks of how to deal with the negative event ); positive reappraisal (the person thinks of giving a positive meaning to the negative event); putting into perspective (the person relates the events to other events)(Kamalinasab &Mohammadkhani,2018).
While maladaptive CERS include: self-blame (the person blames himself/herself for the incidents); blaming-others (the person blames others for the negative event); catastro-phizing (the person focuses on the terror of the experience); rumination (feelings and thoughts accompanied with the unpleasant event) (Garnefski, Teerds, Kraaij, Legerstee & Van Den Kommer, 2004).
TA as Zeidner (1998) regards it is a feeling of agitation or distress. It is a situational-based anxiety. In other words, it is the testing situation that elicits it. Different situations can elicit two main subtypes of test anxiety – trait anxiety and state anxiety (Cunha & Paiva, 2012). Test anxiety occurs when a student has a predisposition to display a certain level of anxiety, whether being high or low. This level of anxiety applies across subject areas, regardless the content or test difficulty. State anxiety occurs when a student fails to prepare for a test.
AA can be seen as student's ability to control or manage the social challenges and knowledge especially when he/she transits to college life. those who are able to adjust academically will be successful (Anderson, Guan, & Koc, 2016). Khabirul & Ujjwal,2018) referred to negative correlation between TA and adjustment of the male and female students.
However, still, little attention was paid to the relationship between the relationship between TA and AA among college students as mediated by adaptive/maladaptive CERS, although its importance for college students.
The purpose of this study was to investigate the relationship between and among Adaptive/Maladaptive CERS, TA and AA, and the possibility of Adaptive/Maladaptive CERS to mediate the relationship between TA and AA. We hypothesized that the association between test TA and AA is mediated by Adaptive/Maladaptive CERS (see Figure 1).
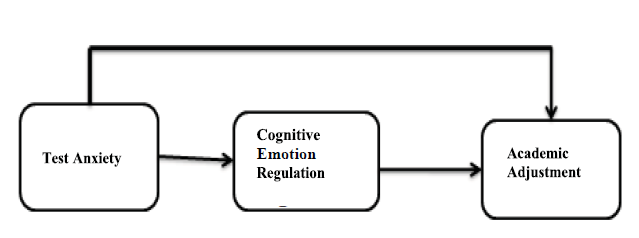
Figure 1. Conceptual Model of the Research.
Hypotheses
Hypothesis 1: There is a negative correlation between adaptive cognitive CERS and TA.
Hypothesis 2: There is a positive correlation between adaptive CERS and AA.
Hypothesis 3: Adaptive/Maladaptive CERS mediate the relationship between TA and AA.
Methodology
Participants
Convenient sampling method was employed to recruit the participants. The sample of the study consisted of 180 students (100% males) representing students from college of education, Jazan University, KSA, aged 19-21 years, with an average of 20.2 years, with a standard deviation of 5.45.
Design
Quantitative survey research was employed, with CERS as IV, and TA and AA as Dvs.
Instruments
CERQ (Garnefski , Kraaij & Spinnhoven,2001) is a 36 items scale . The CERQ contains nine subscales: 5 for adaptive strategies (acceptance, positive refocusing, refocusing on planning, positive reappraisal and putting into perspective) and 4 for maladaptive strategies (self-blame, rumination, catastrophising and blaming others). Each strategy has four items on a five-point scale ranging from 1 (“Almost never”) to 5 (“Almost always”). The adaptive strategies sub scale was adopted in this study. For reliability, test-retest reliability was .86. A content validity index was calculated at the item level (I-CVI = 0.90).
CTAS (Jerrell & Ronald ,2002). It is a 27-item scale. The Scale follow 4 point Likert scale ( Not at all typical of me, Only somewhat typical of me, Quite typical of me, and Very typical of me). Test-retest reliability was .92. For convergent validity of Cognitive Test Anxiety scale, correlation with Mourad's Cognitive Test Anxiety scale (2010) was good [r(60) =0.64, p <0.0l).
SACQ(Baker and Sirk ( 1989). The aim of this scale was to measure how well students adjust to college experience . It has two subscales: AA and SA. Each scale comprised 25 items, rated on a 4-point Likert-type scale, with higher scores reflecting academic/social adjustment . Both scales required respondents to rate their level of agreement or disagreement, indicating “very true”, or “somehow true”, or “not true”, or “not true at all. The academic adjustment sub scale was adopted in this study. For reliability the alpha coefficients are .90.
Data analysis
PC and moderated HMRA were conducted to test the hypotheses.
Results
Descriptive data and inter-correlations
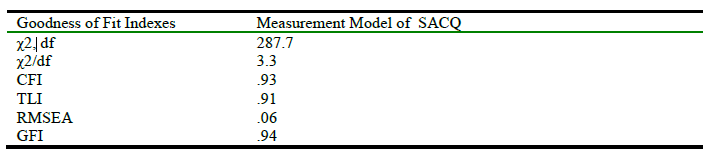
CFA was conducted for testing item-factor structure of the scale. Model fit indices showed acceptable goodness of fit values for one factor structure of 25 items of the scale. The indices found for the scale and acceptable ranges are presented in Table1.
Table 1.
Model fit indices from measurement models of SACQ.
In the second part of CFA results, unstandardized and standardized parameter estimates were examined as presented in Table 2.
Table 2.
Unstandardized and standardized parameter estimates for SACQ.
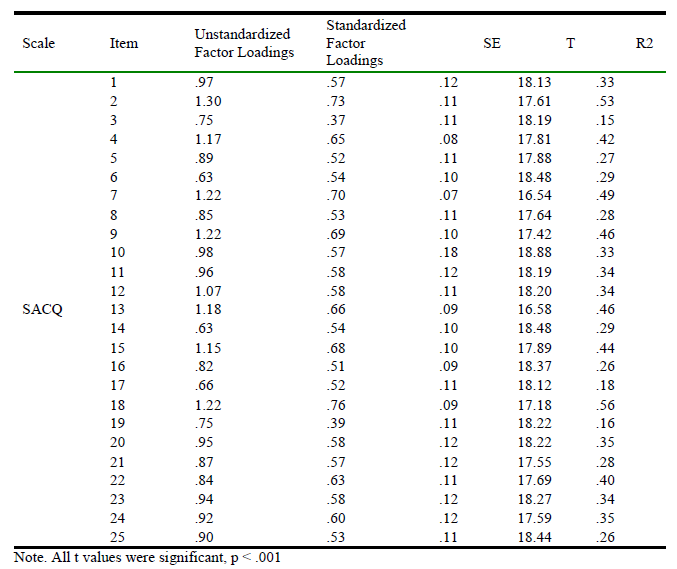
As seen in Table 2, standardized factor loadings for one factor structure of SACQ have values between .37 and .76 and all t values are significant for all of the items.
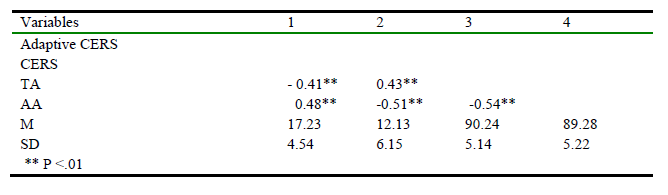
Table 3 shows the means, descriptive statistics and inter-correlations of Adaptive/Maladaptive CERS, TA and AA. As shown in table 1. Adaptive CERS correlates negatively with TA (r = - 0.41), and also negatively with AA (r = - 0.51).On the other hand, Maladaptive CERS was found to be positively correlated with AA (r = 0.48) .While AA found to be negatively correlated with TA(r = -0.54).
Table 3.
Descriptive statistics and inter‑correlations of adaptive CERS, TA and AA.
Path Analysis
In order for testing the hypothesized model, the Amos v.24 was employed. Also CFI was employed in order to compare the hypothesized model to a null model. RMSEA was employed to assess the discrepancy between the estimated and population parameters. Our model produced a fair fit with a significant chi square χ2 (33, N = 180) = 93.15, p b 0.001, CFI = 0.93, and RMSEA = 0.06. The CFI value suggested an adequate fit. Table 4 shows the factor loadings from the final measurement model. Figure 2 demonstrates all the standardized path coefficients of the Model.
Table 4.
Goodness of Fit Statistics for the Final Measurement Model.
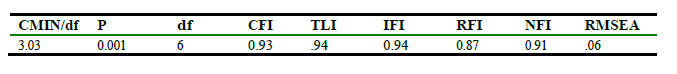
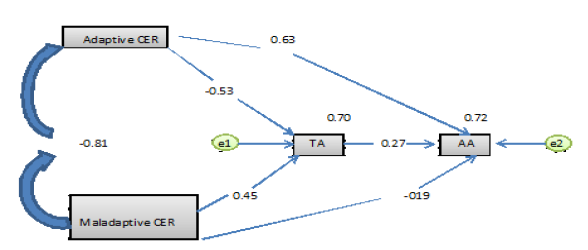
Figure 2. The standard coefficients of the proposed model.
Table 5 shows estimates of path coefficients for the saturation model. As it can be seen, the coefficients related to the Adaptive CER regression paths to TA and AA, Maladaptive CER regression paths to TA and AA are significant (p<0.01)regardless of their direction.
Table 5.
Standard and non-standard regression coefficients along with significant levels of variables in the model.
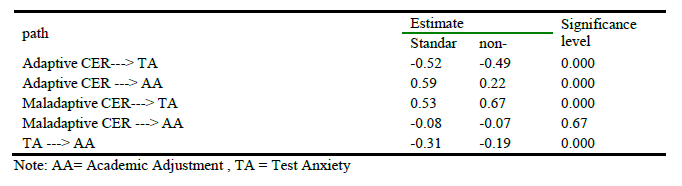
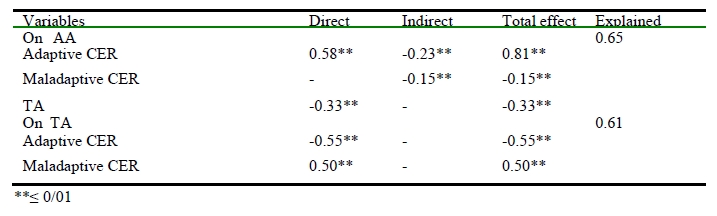
Table 6 shows the standard coefficients of direct path, indirect path, total effect and the explained variance of the variables in the reformed model.
According to the table, direct, indirect effects and the total effect of all paths are significant (p<0.01). So that the D.EFF. of Adaptive CER on AA (0.58) and the D.EFF. of TA on AA(- 0.33) are significant at 0.01 level. It can be noted that because D.EFF. of Maladaptive CER on AA was not significant in the first stage of fitting the model, it was exclude from. Also, TA academic self- handicapping (-0.55) and Maladaptive CER on TA (0.50) is significant (p<0.01). Moreover, ID.EFFS. of Adaptive CER and Maladaptive CER on AA were calculated through TA. Their coefficients are -0.23 and -0.15 respectively, which is significant(p<0.01).
It was also indicated that Adaptive CER, Maladaptive CER and TA can explain 0.65 of AA changes. Also, Adaptive CER and Maladaptive CER can explain 0.61 of TA changes.
Table 6. The standard coefficients of the direct path, indirect path, total effect and the explained variance of the variables in the reformed model.
Discussion
The aim was to investigate the relationship between and among Adaptive/Maladaptive CERS, TA and AA, and the possibility of Adaptive/Maladaptive CERS to mediate the relationship between TA and AA. We hypothesized that the association between TA and AA is mediated by Adaptive/Maladaptive CERS.
The results of this study revealed that adaptive CERS correlates negatively with TA, and also negatively with AA. On the other hand, Maladaptive CERS was found to be positively correlated with AA. While AA found to be negatively correlated with TA.
From our findings, Maladaptive CERS are related to TA. This finding is consistent with other researchers' findings (D'Avanzato et al., 2013; Garnefski and Kraaij, 2007; Garnefski et al., 2002 ; Martin and Dahlen, 2005).
Consistently with previous studies (Garnefski et al., 2002; Kraaij et al., 2002; Martin and Dahlen, 2005; Garnefski and Kraaij, 2007; Aldao et al., 2010; Joormann and Gotlib, 2010), the relationships between the study variables were in the expected direction, i.e., Adaptive CERS were related positively AA negatively to TA, supporting the idea that emotion regulation might be one of the important aspects of academic adjustment. The four maladaptive CER strategies are rumination, self-blame, blaming of others and catastrophising, and they can lead to psychological and emotional problems such as depression, anxiety or risky behaviours (Extremera&Rey,2014). By contrast, positive refocusing, refocusing on planning, acceptance, putting into perspective and positive reappraisal are the five adaptive strategies that are related to better mental health and well-being (Garnefski, Kraaij & Spinnhoven,2001). Thus, emotion regulation makes a significant contribution to academic adjustment.
Direct, indirect effects and the total effect of all paths are significant (p<0.01). So that the D.EFF. of Adaptive CER on AA (0.58) and the D.EFF. of TA on AA (- 0.33) are significant at 0.01 level. It can be noted that because D.EFF. of Maladaptive CER on AA was not significant in the first stage of fitting the model, it was excluding from. Also, TA academic self- handicapping (-0.55) and Maladaptive CER on TA (0.50) is significant (p<0.01). Moreover, ID.EFFS. of Adaptive CER and Maladaptive CER on AA were calculated through TA. Their coefficients are -0.23 and -0.15 respectively, which is significant (p<0.01). It was also indicated that Adaptive CER, Maladaptive CER and TA can explain 0.65 of AA changes. Also, Adaptive CER and Maladaptive CER can explain 0.61 of TA changes.
The limitation in this study lies in the use of sampling method, the research only used convenience technique. Future researchers are expected to use another sampling method in data collecting.
The current study has some strengths. First of all, this is the first study addressing adaptive/maladaptive CERS as mediators in the relationship between TA and AA among college students. Secondly, to my knowledge, this is the first study conducted in KSA which addressed CERS in college students using the new world widely used CERQ instrument. Thirdly, I assessed the variables proposed for the study using SRQ, proposing that the college students themselves have the best access to their internal experiences (Jacob, Thomassin, Morelen & Suveg, 2011).
Conclusions
According to the result above, it can be concluded that adaptive CERS correlates negatively with test anxiety, and also negatively with academic adjustment. On the other hand, Maladaptive CERS was found to be positively correlated with academic adjustment. While academic adjustment found to be negatively correlated with TA. The coefficients related to the Adaptive CER regression paths to TA and AA, Maladaptive CER regression paths to TA and AA are significant at 0.01 level regardless of their direction.
Acknowledgment
I express my gratitude to college of education, Jazan University, KSA, and students who have provided support.